How to change your data source
You can change the social media channels from which your account analytics data is sourced. Here’s how:
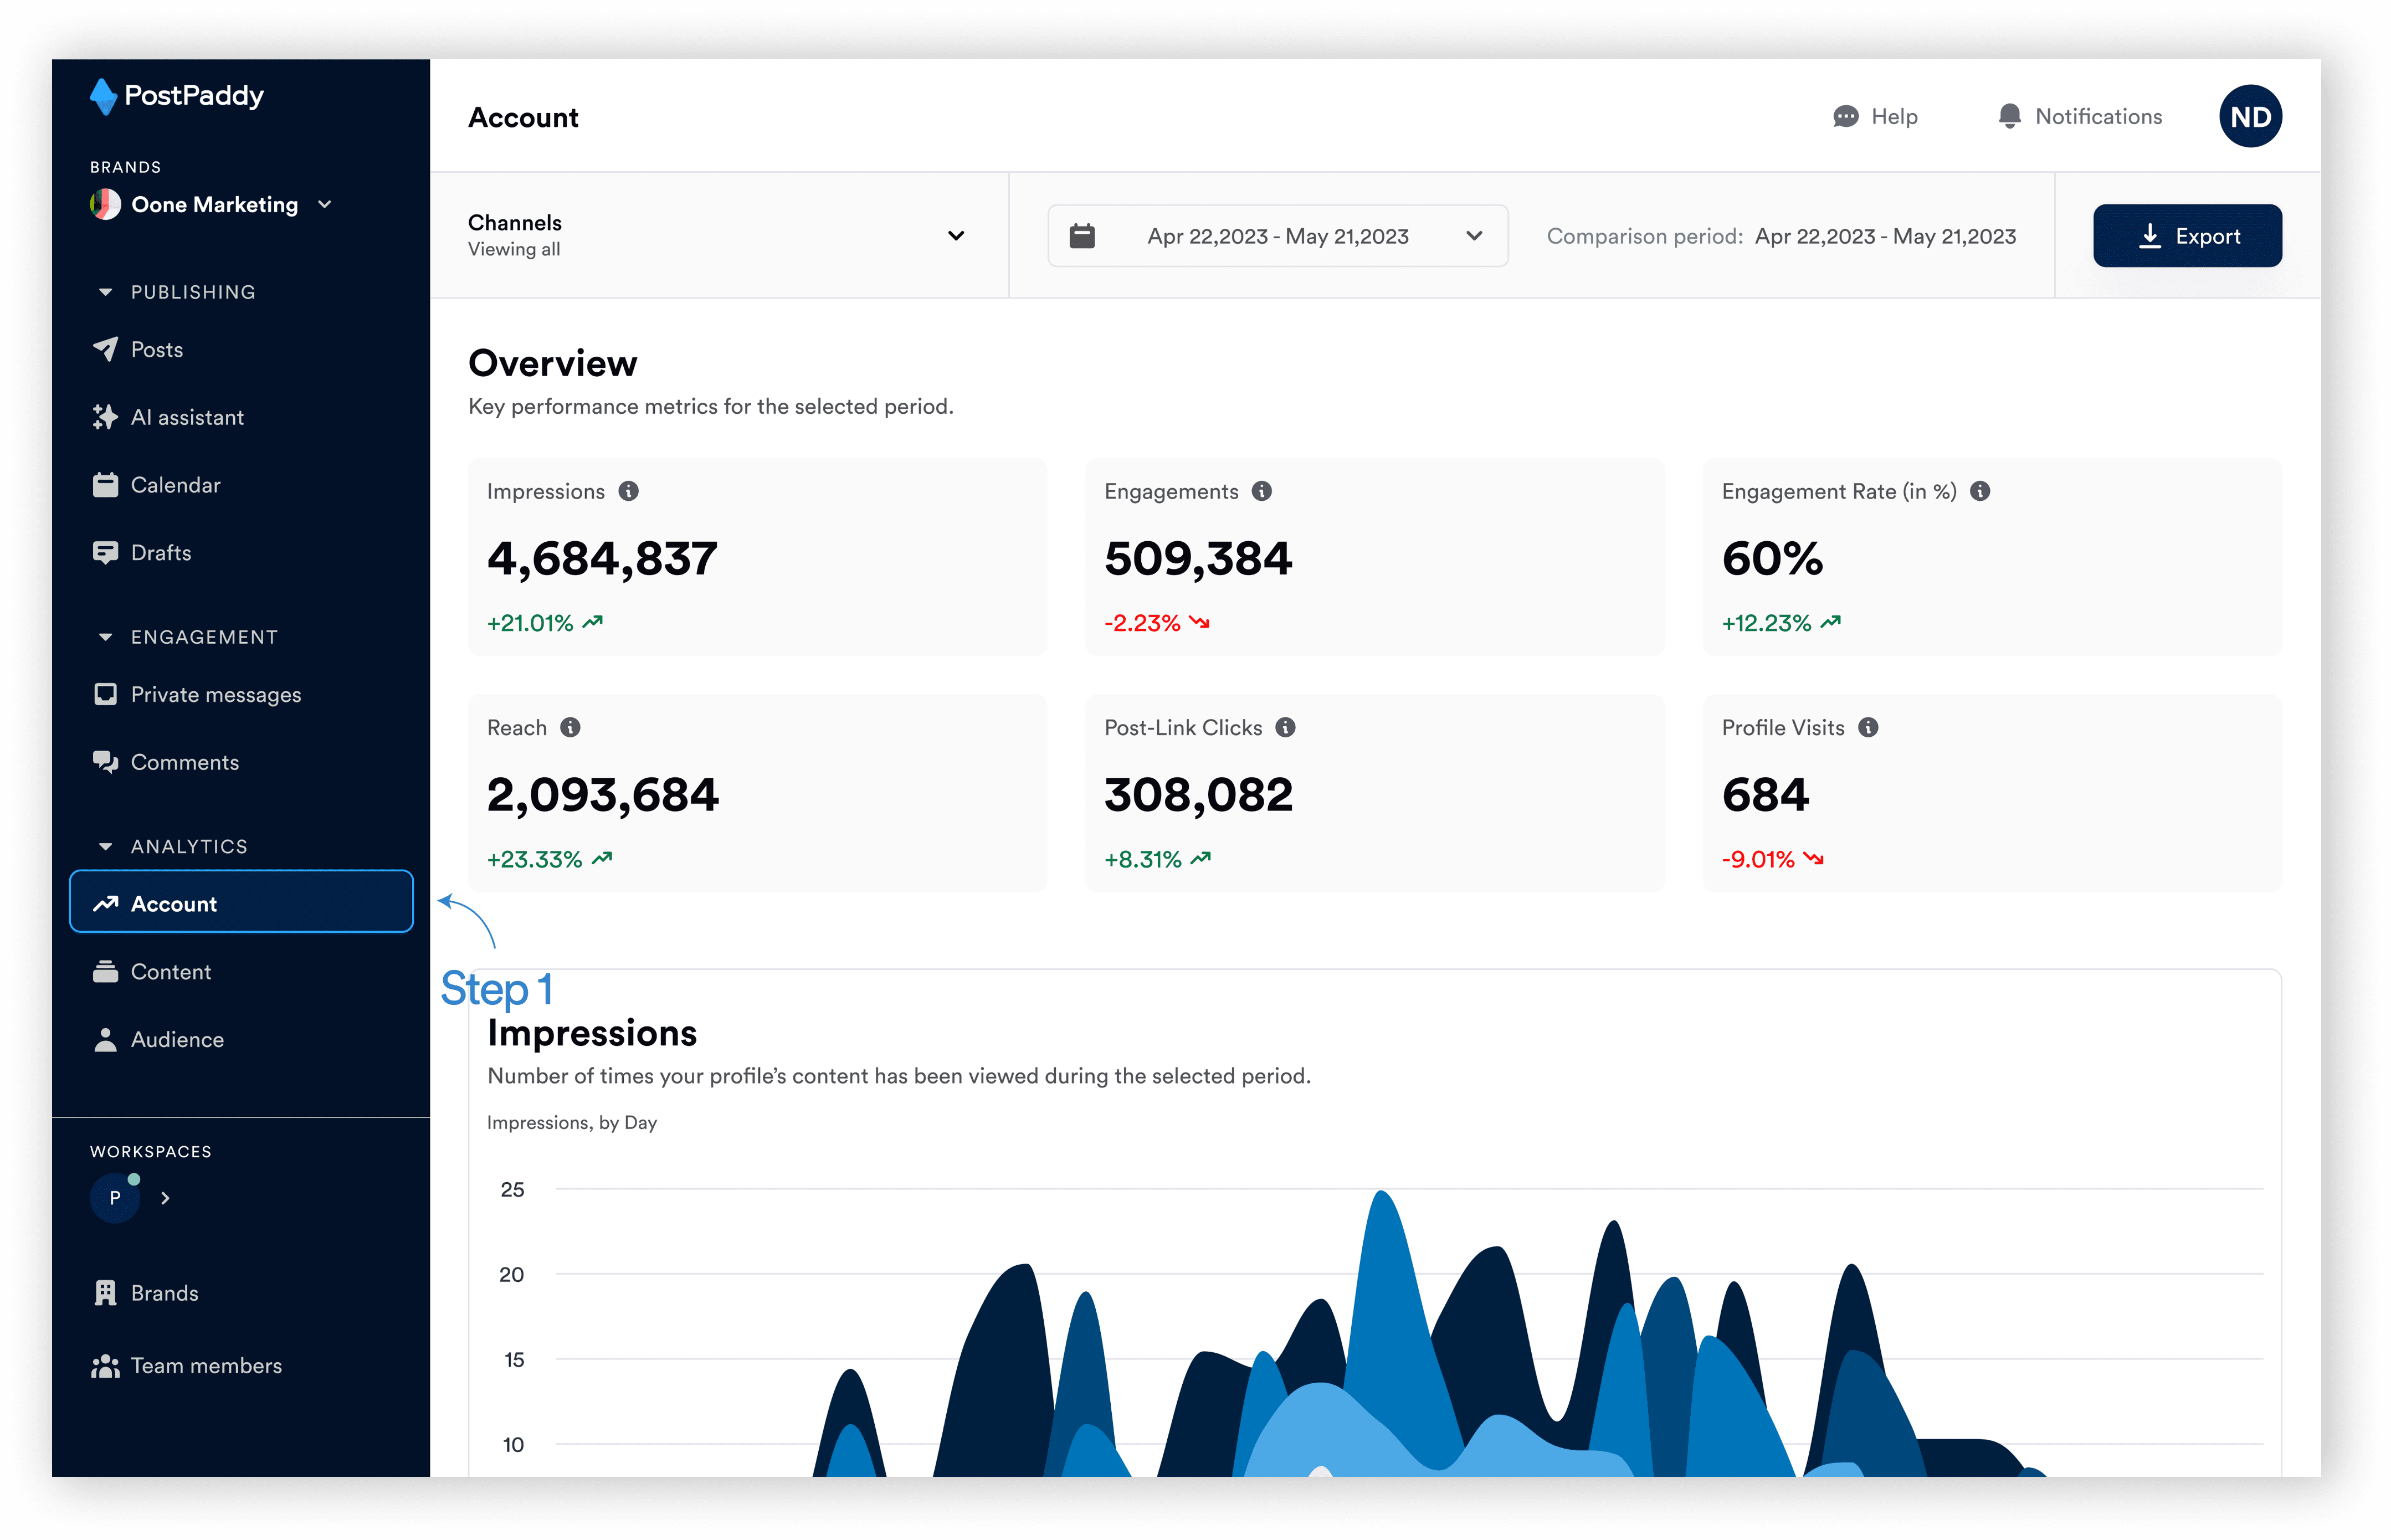
Step 1: On your PostPaddy dashboard, select "Account" on the analytics area of the side navigation bar.
Step 2: Click the channel drop-down.
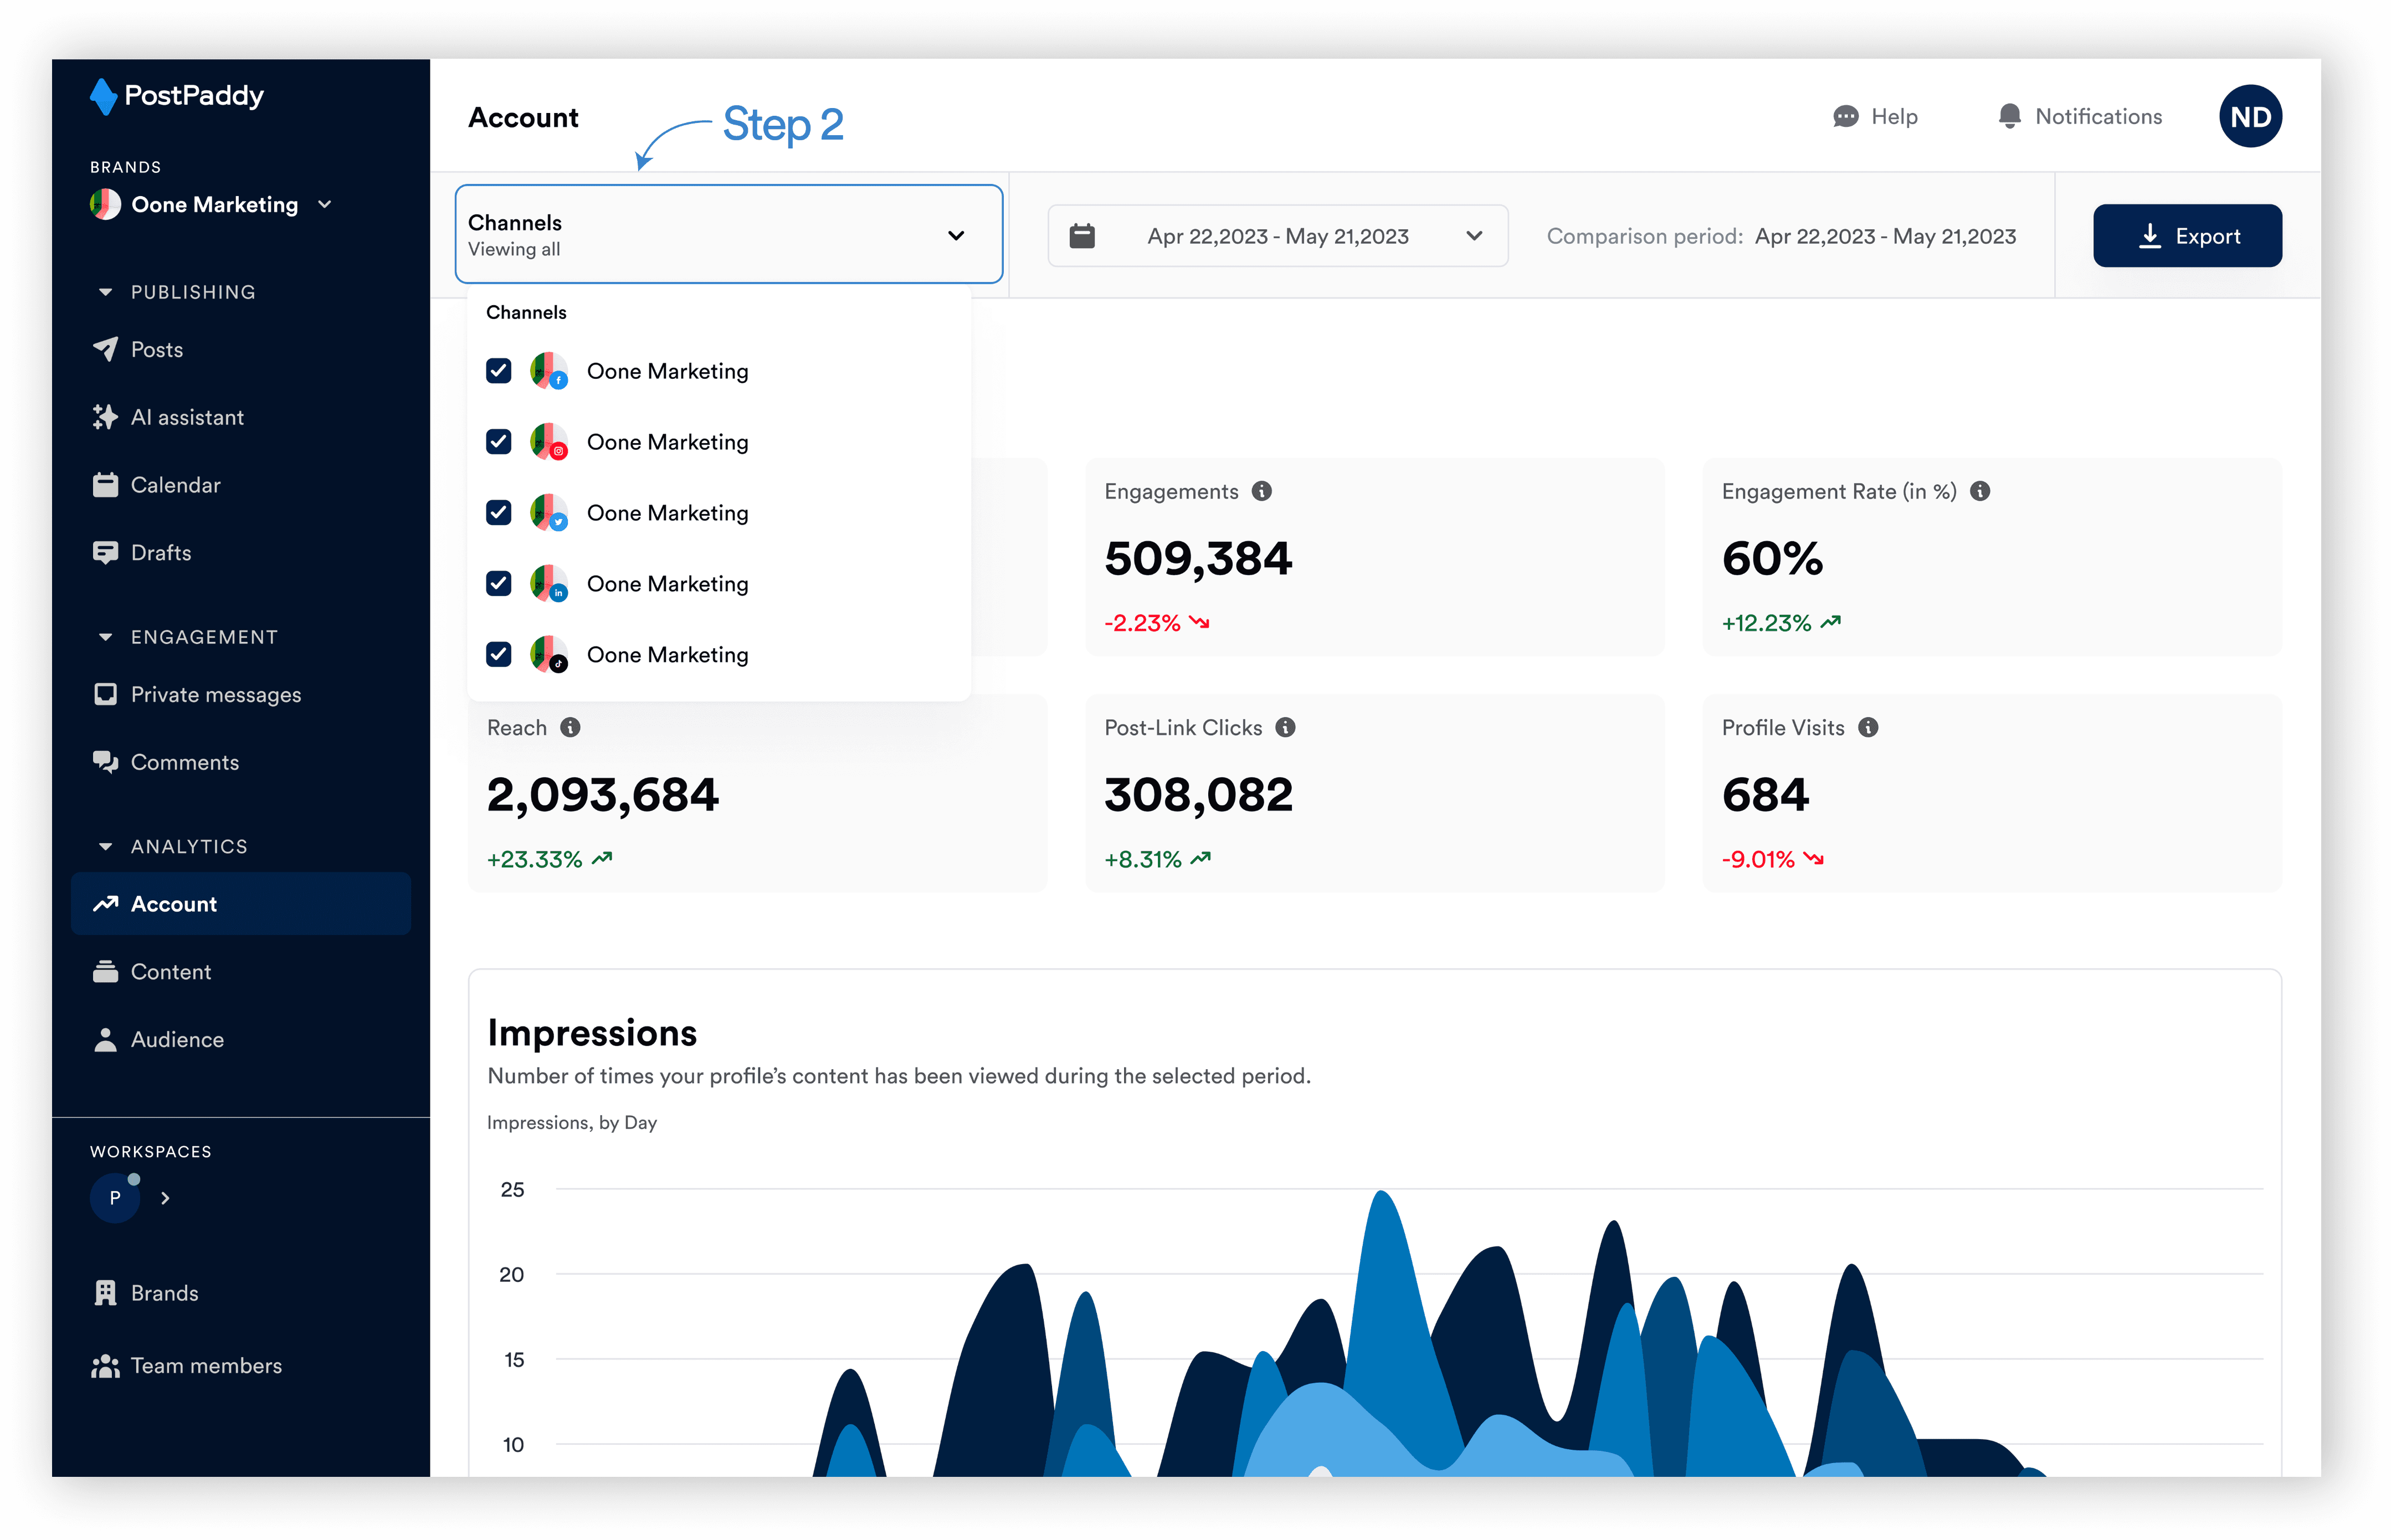
Step 3: Select the desired channel.
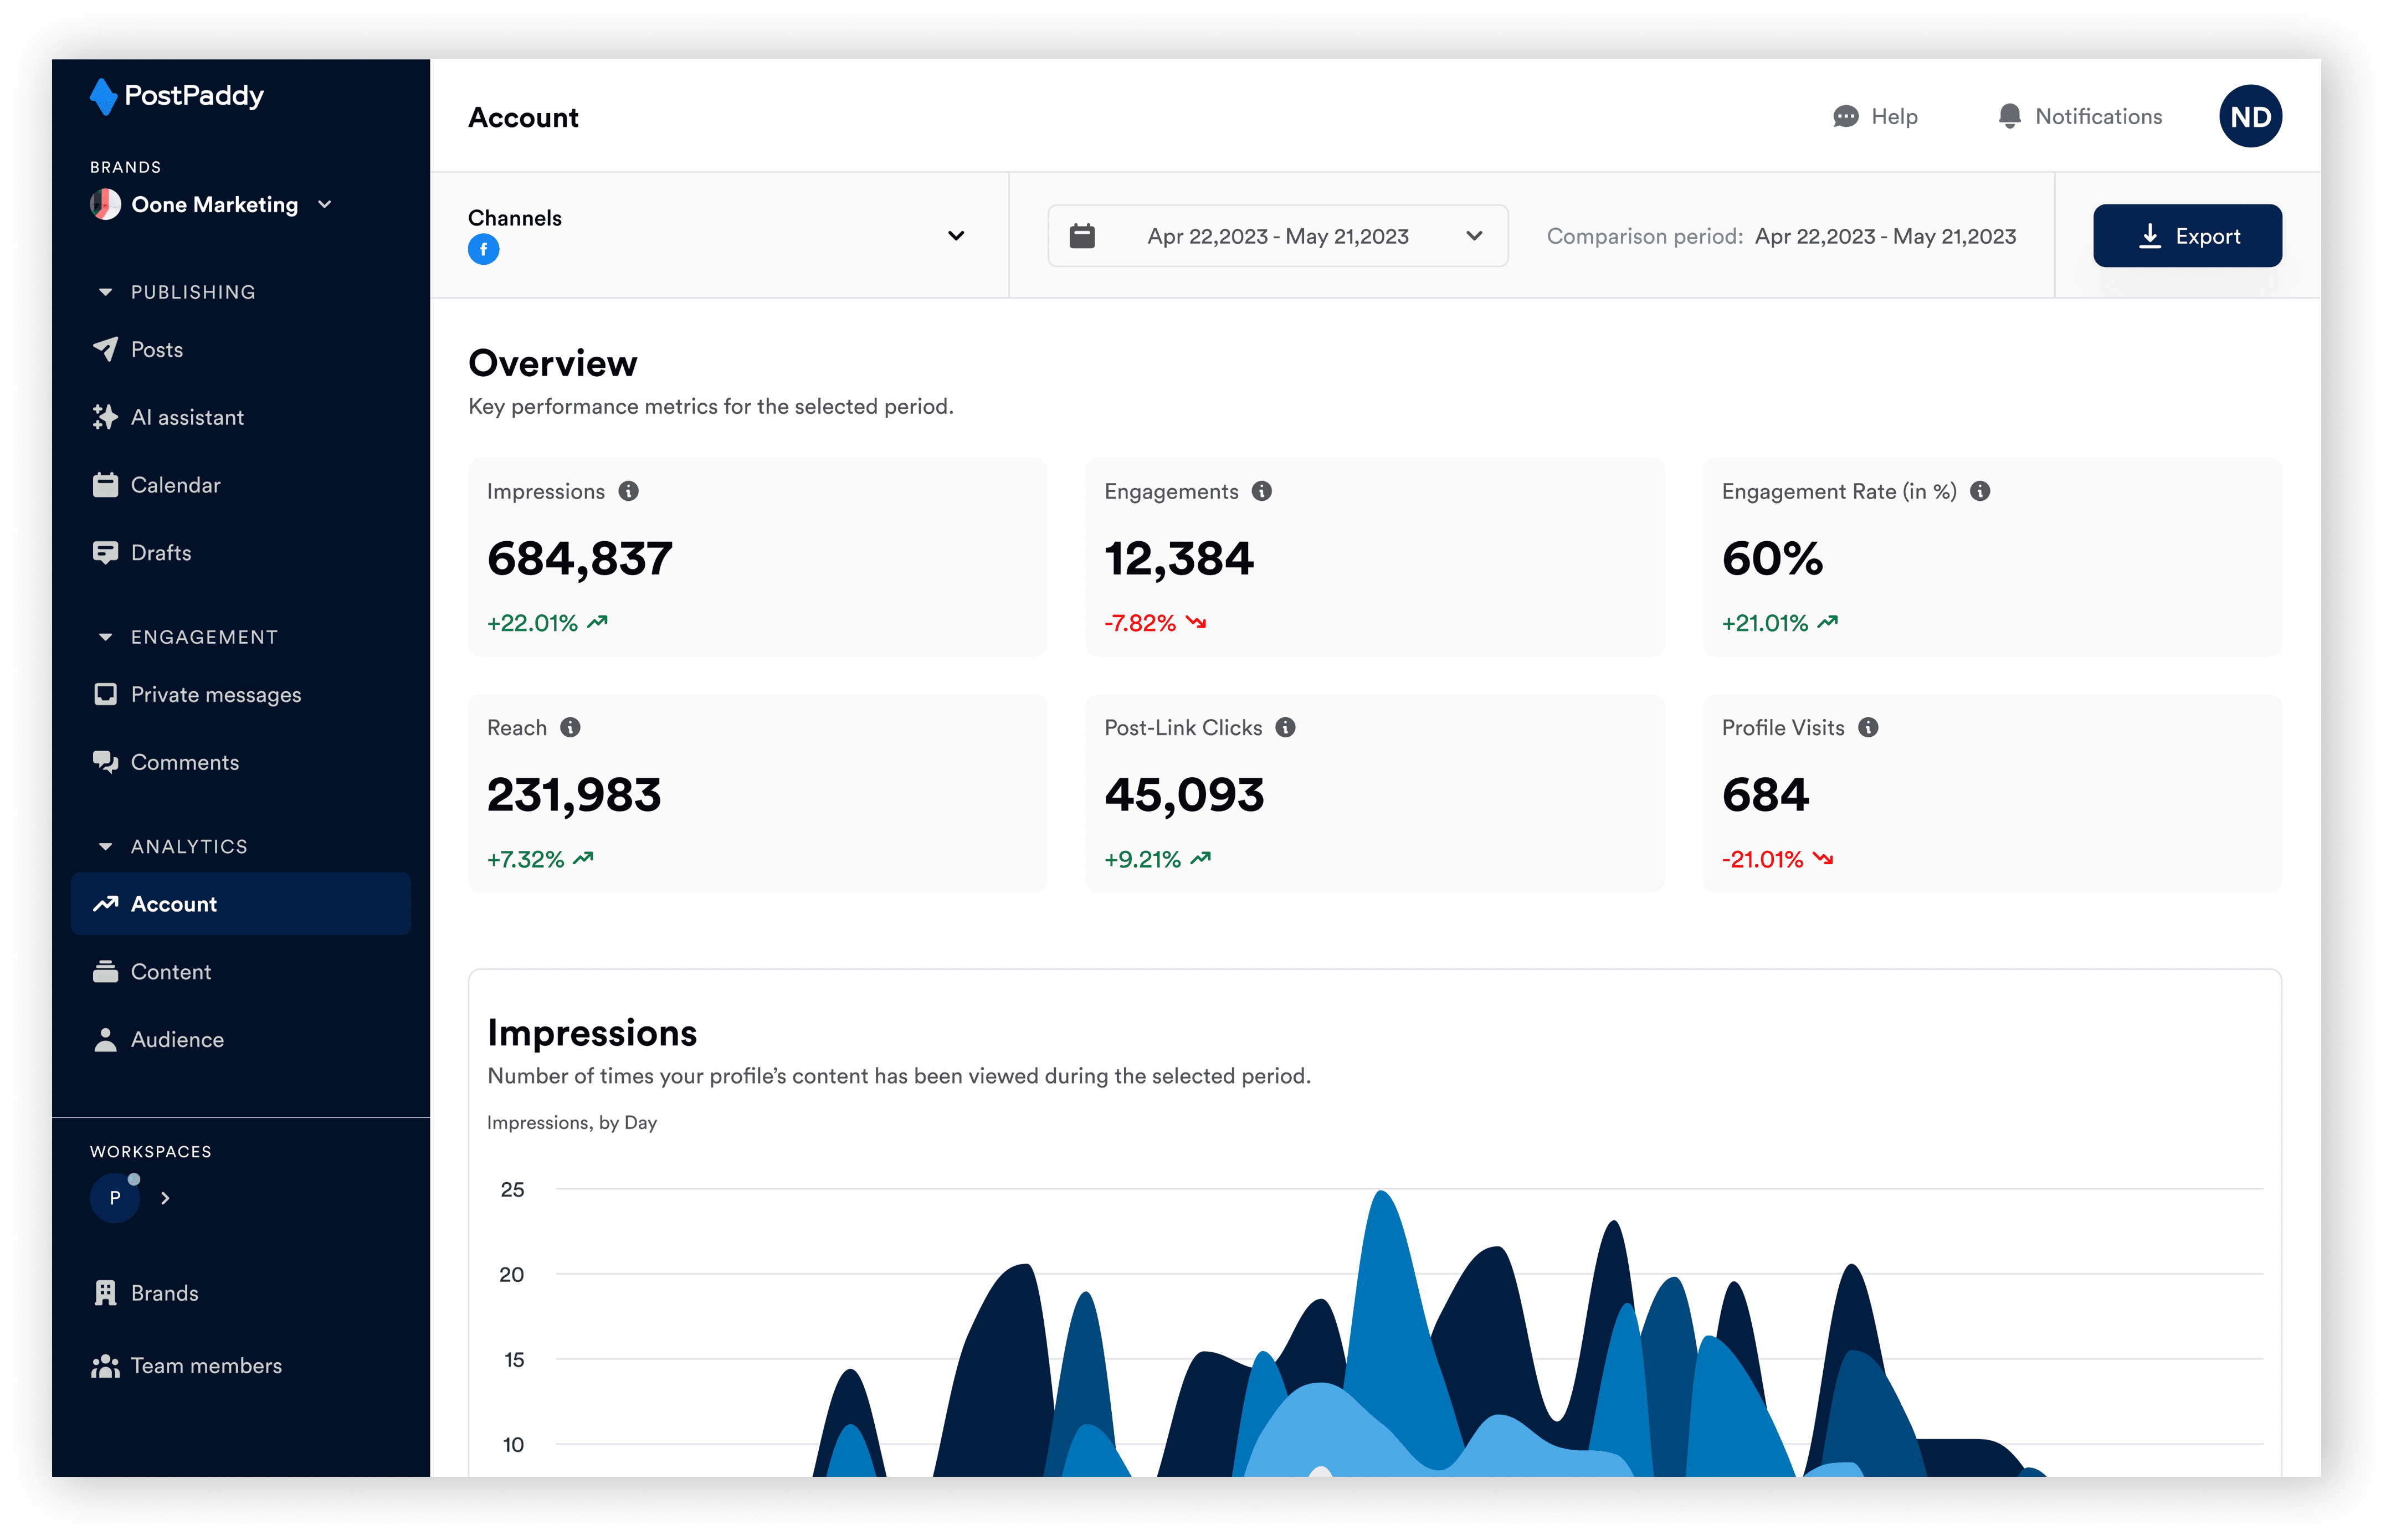
The returned analytics data will be that of the selected channels.
How to use the date filter
You can filter the data by dates. Here’s how:
Step 1: Select "Account" on the analytics area of the side navigation bar.
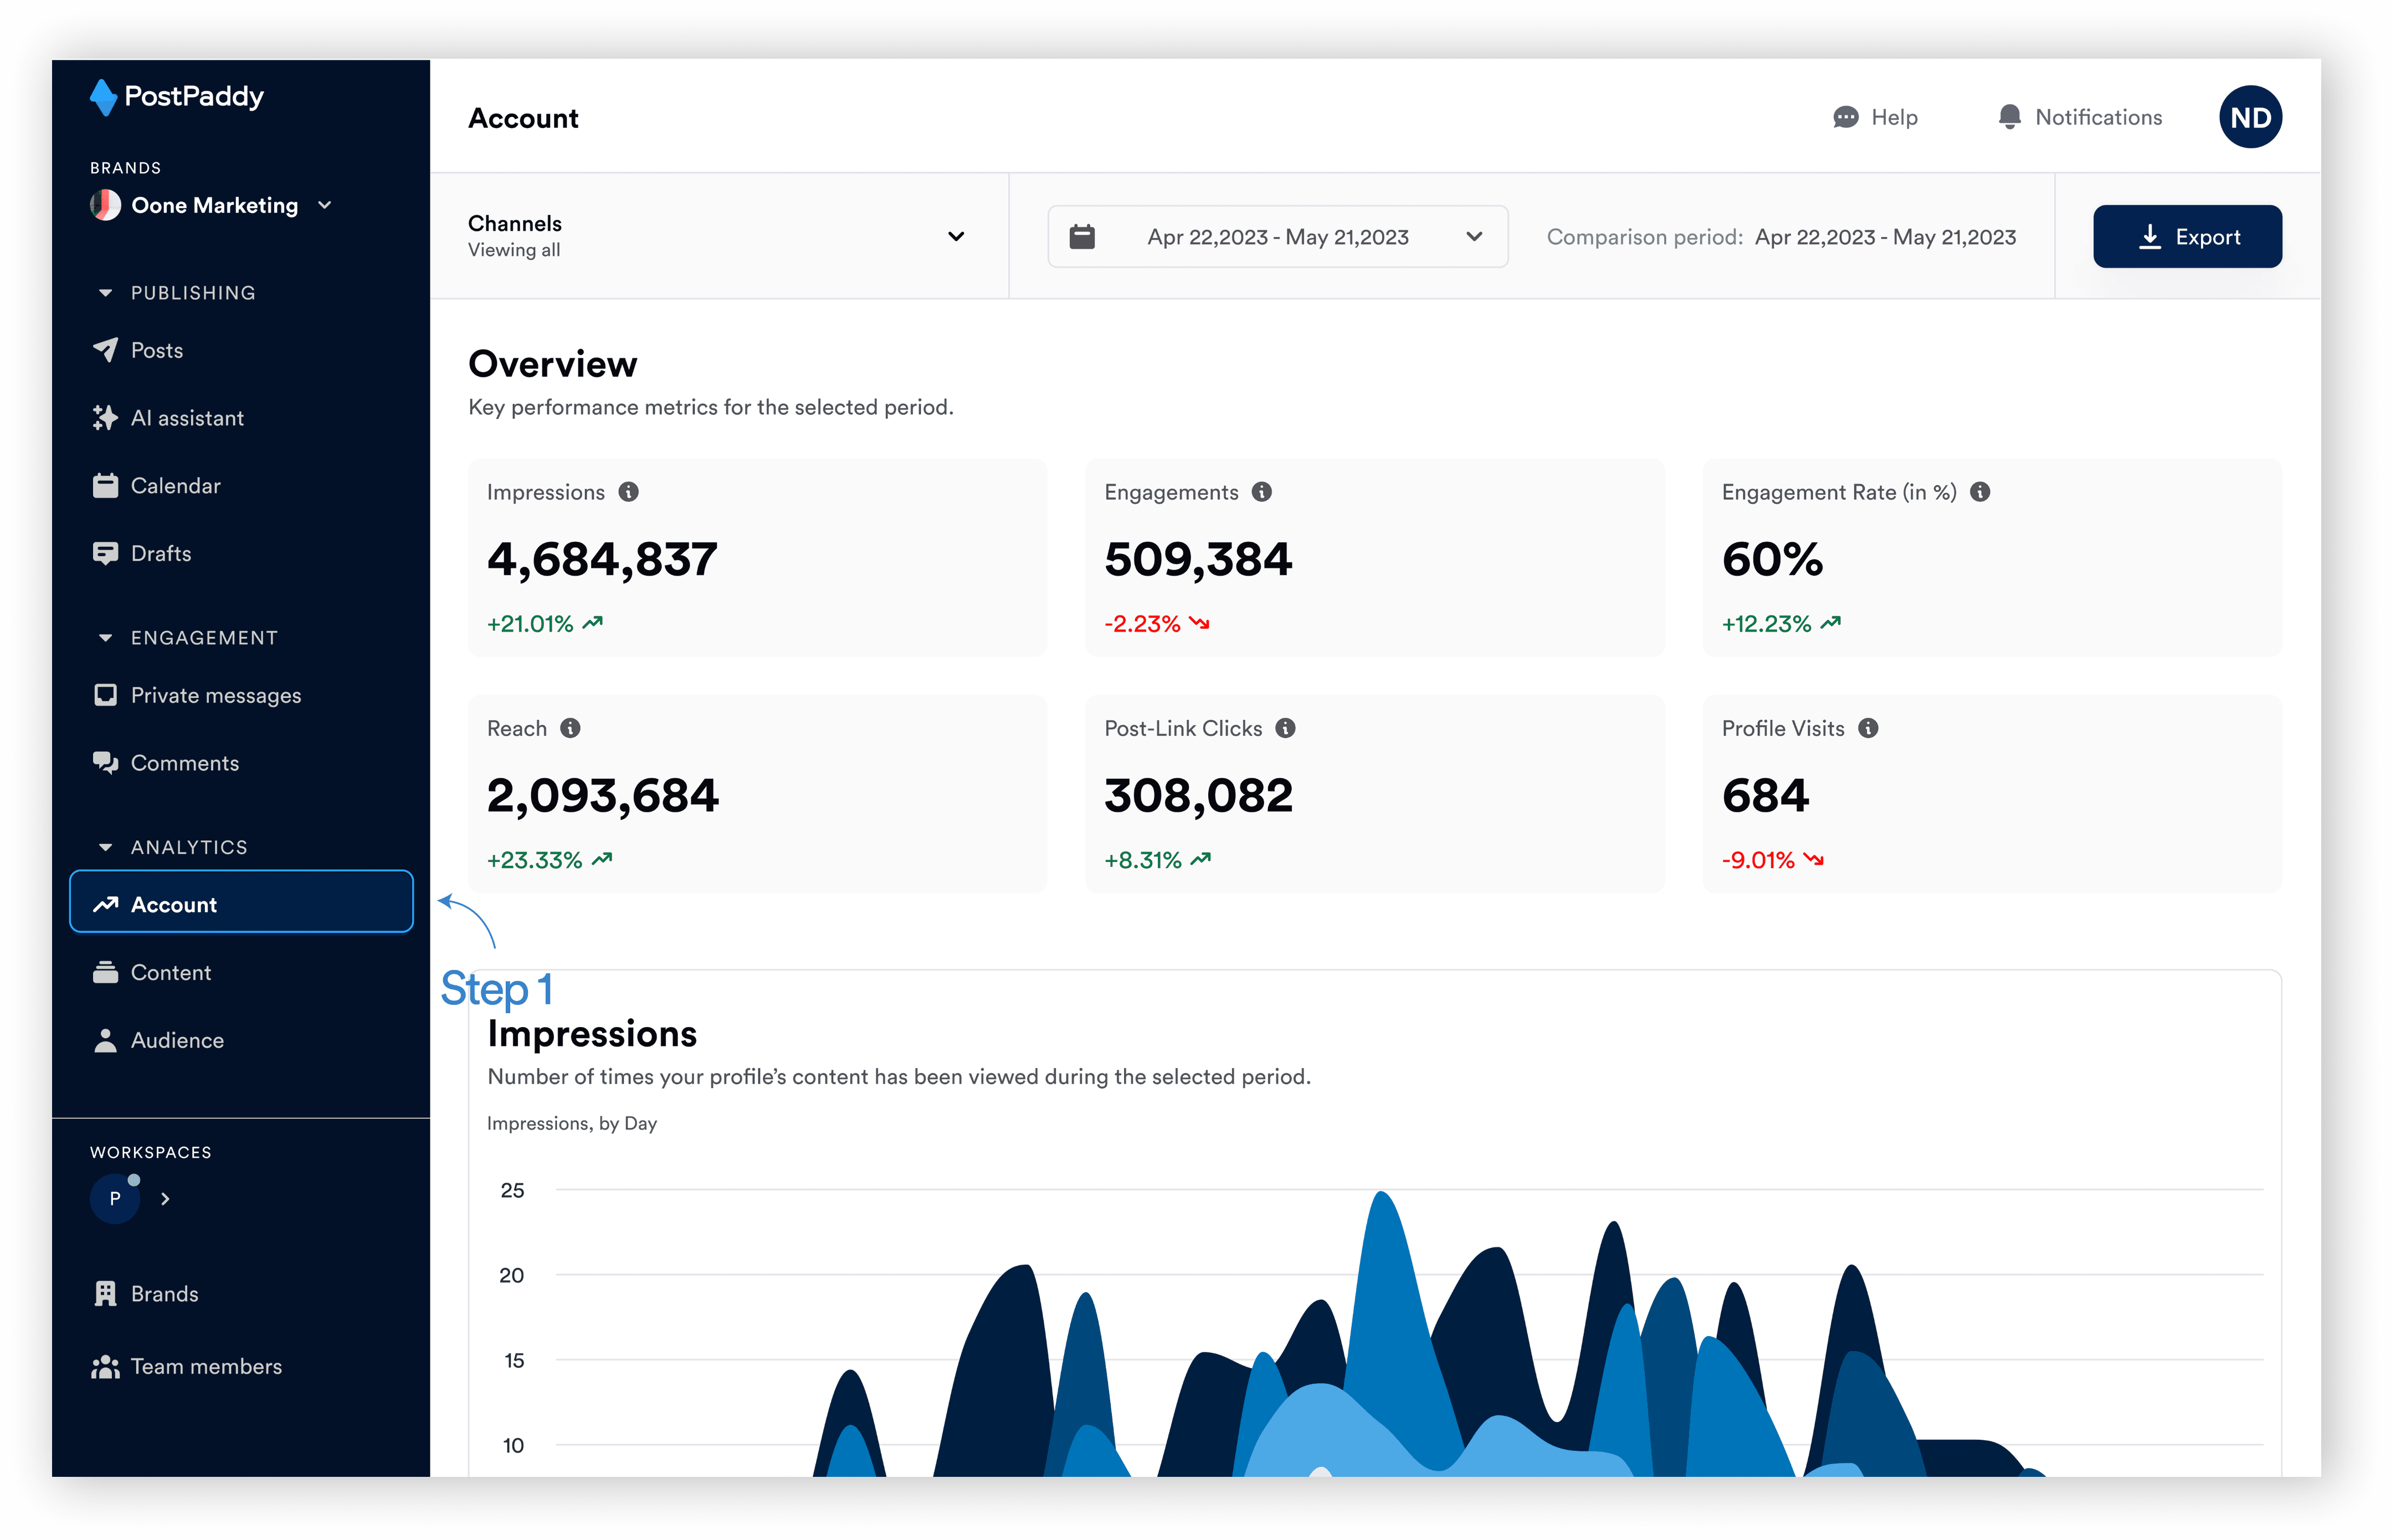
Step 2: Tap on the date filter.
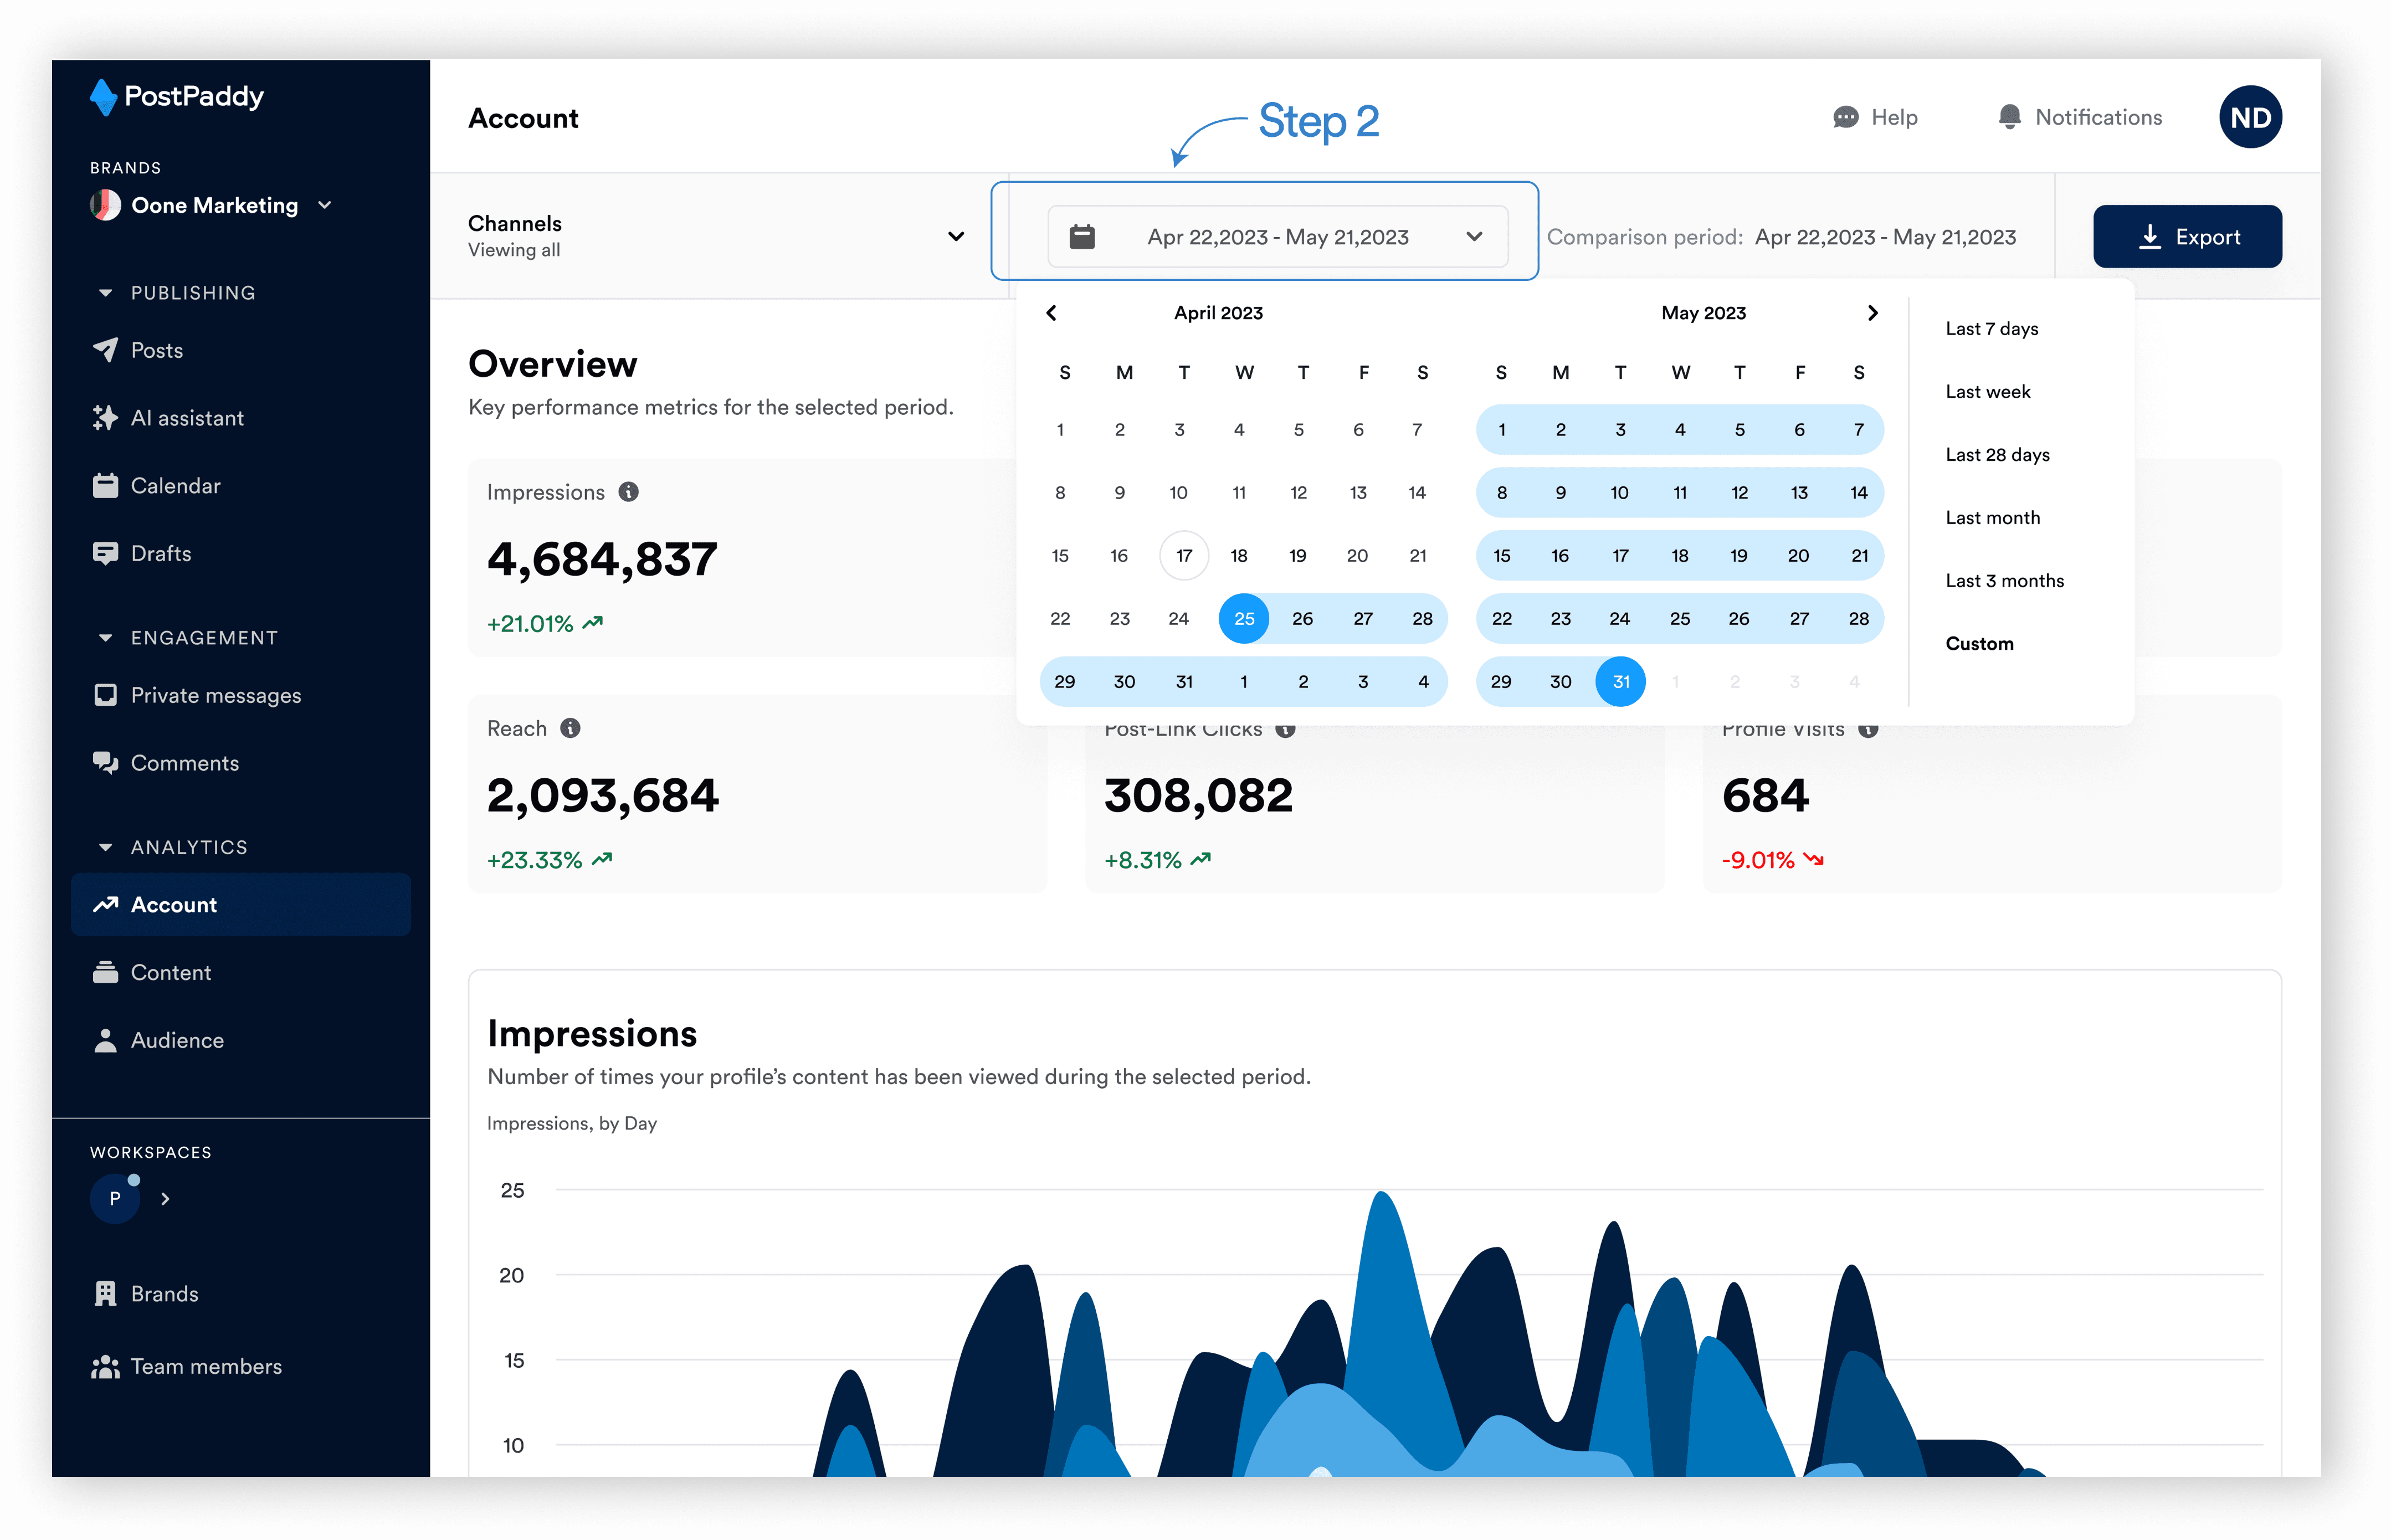
Step 3: Select your desired date
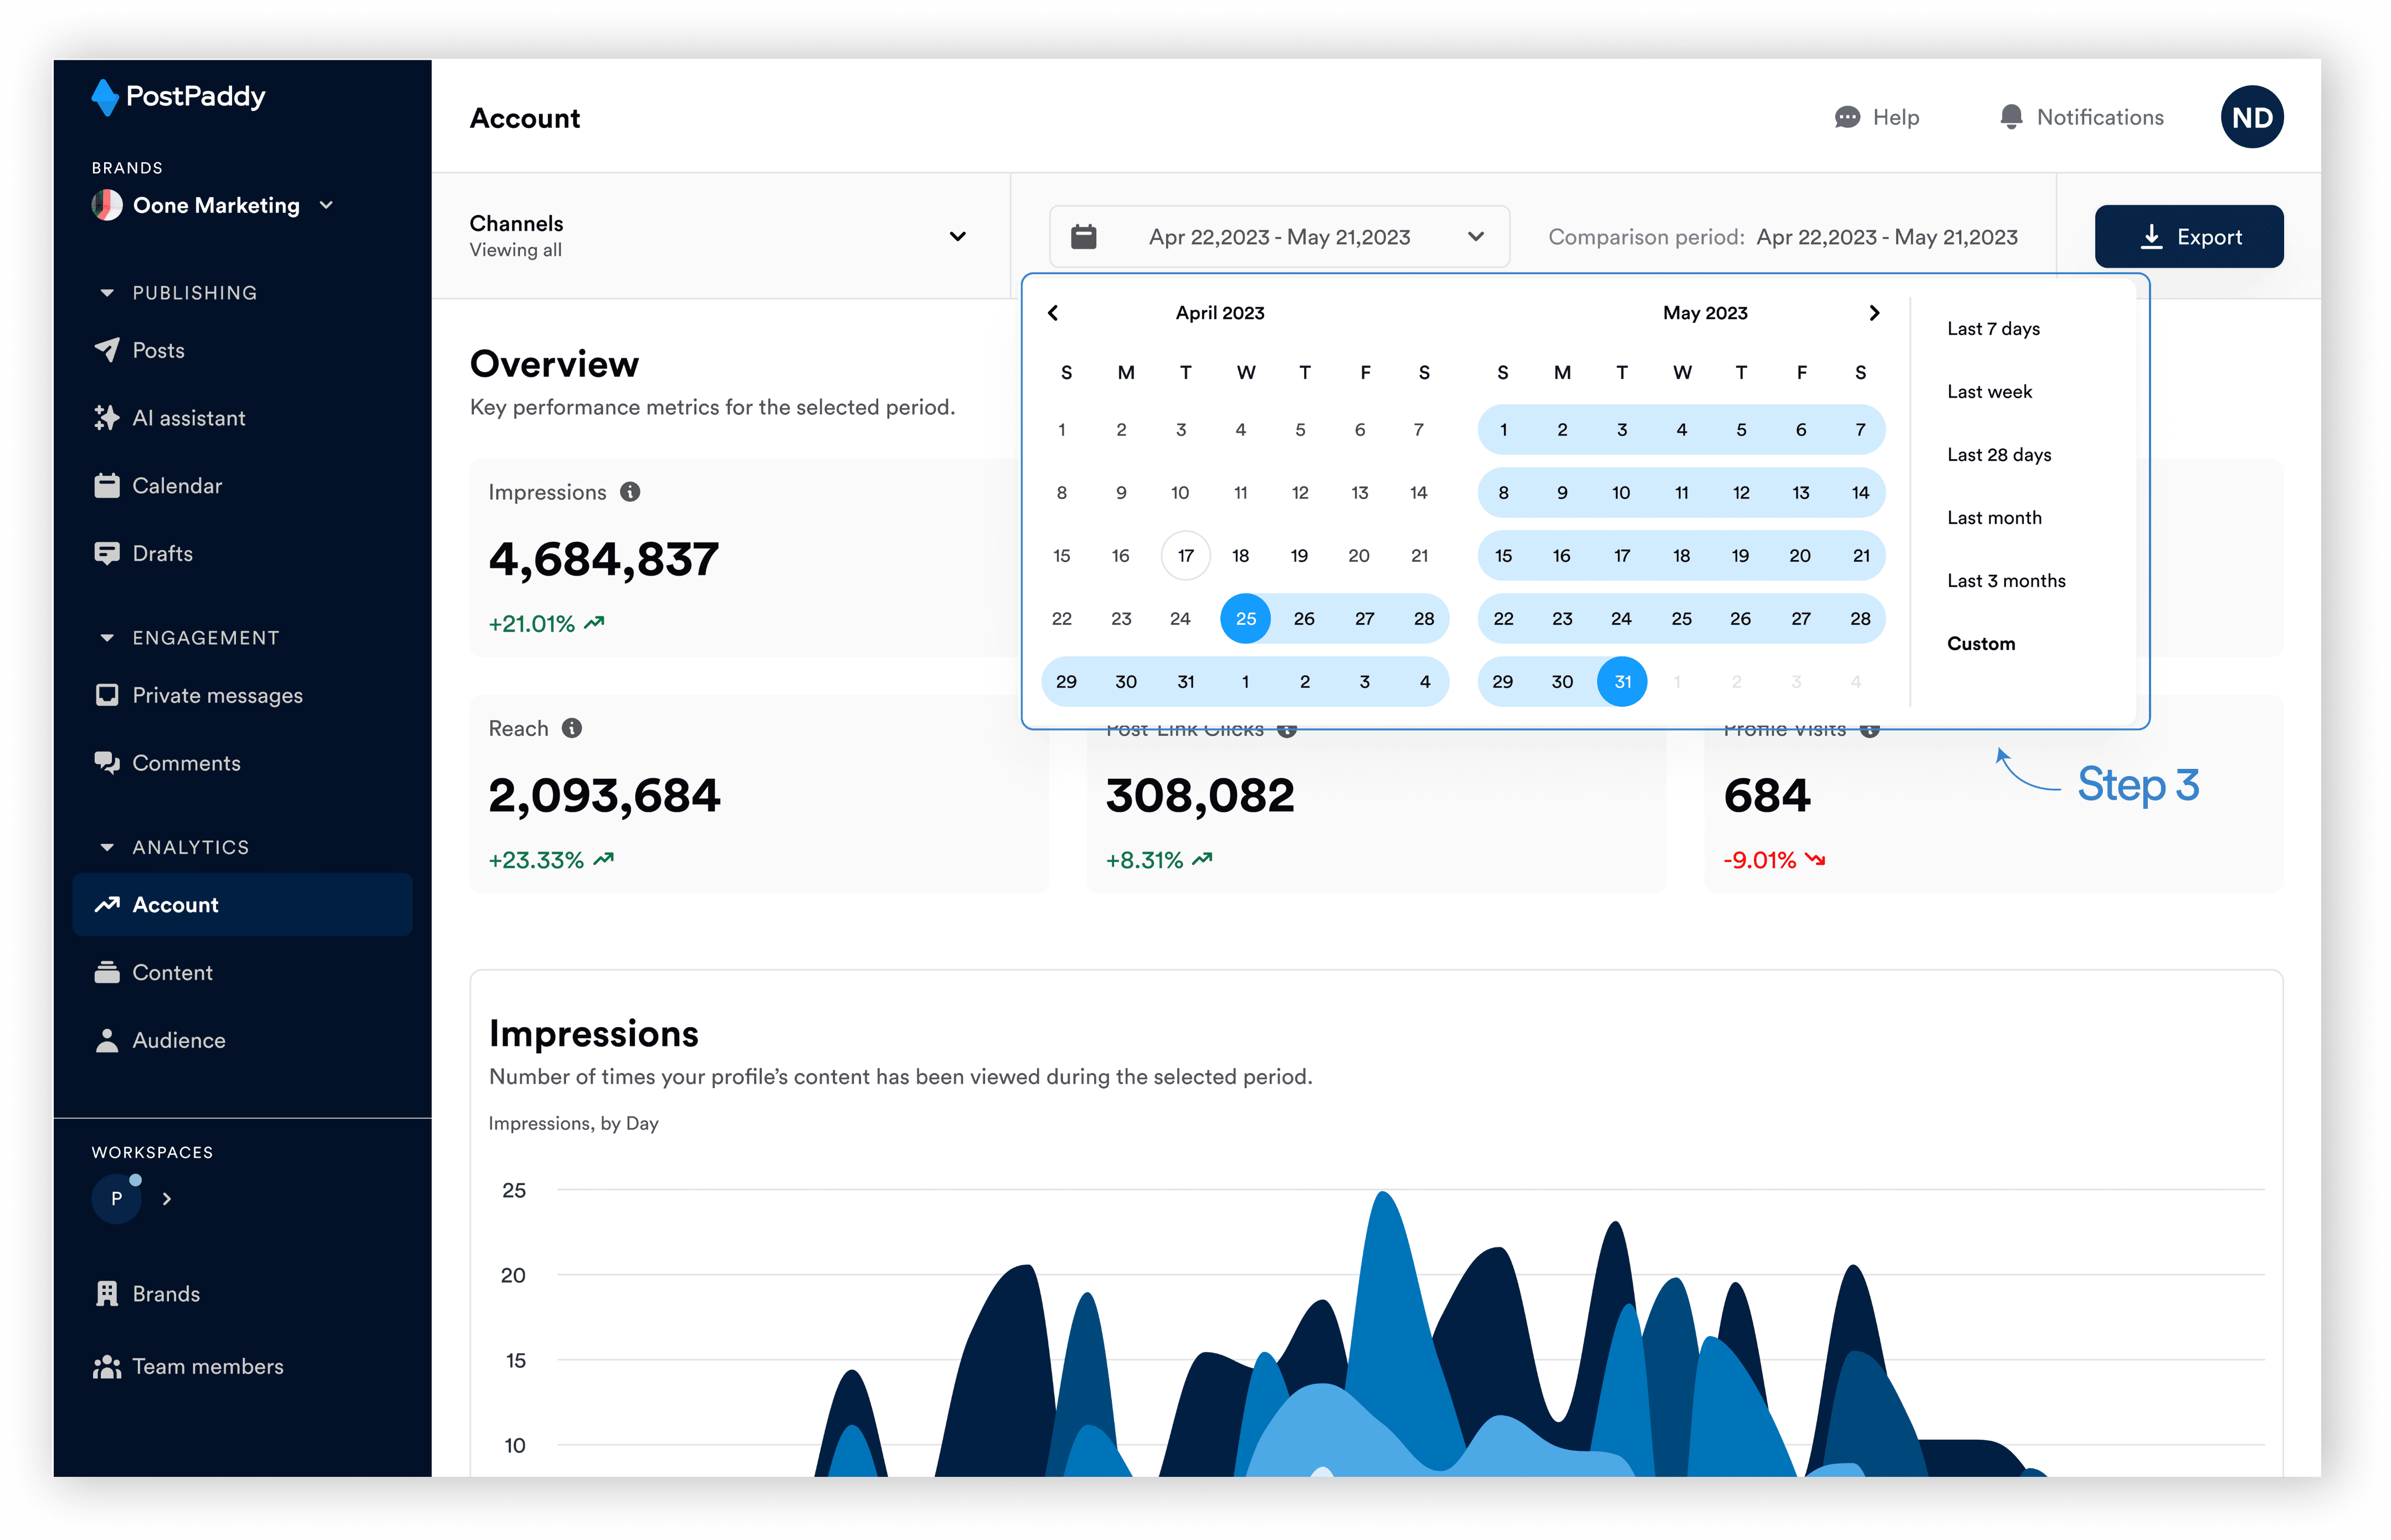
You can now view analytics data within the selected time range.
How to export data
Step 1: Select "Account" on the analytics area of the side navigation bar.

Step 2: Click the export button.

Step 3: Select the export file type (PDF).
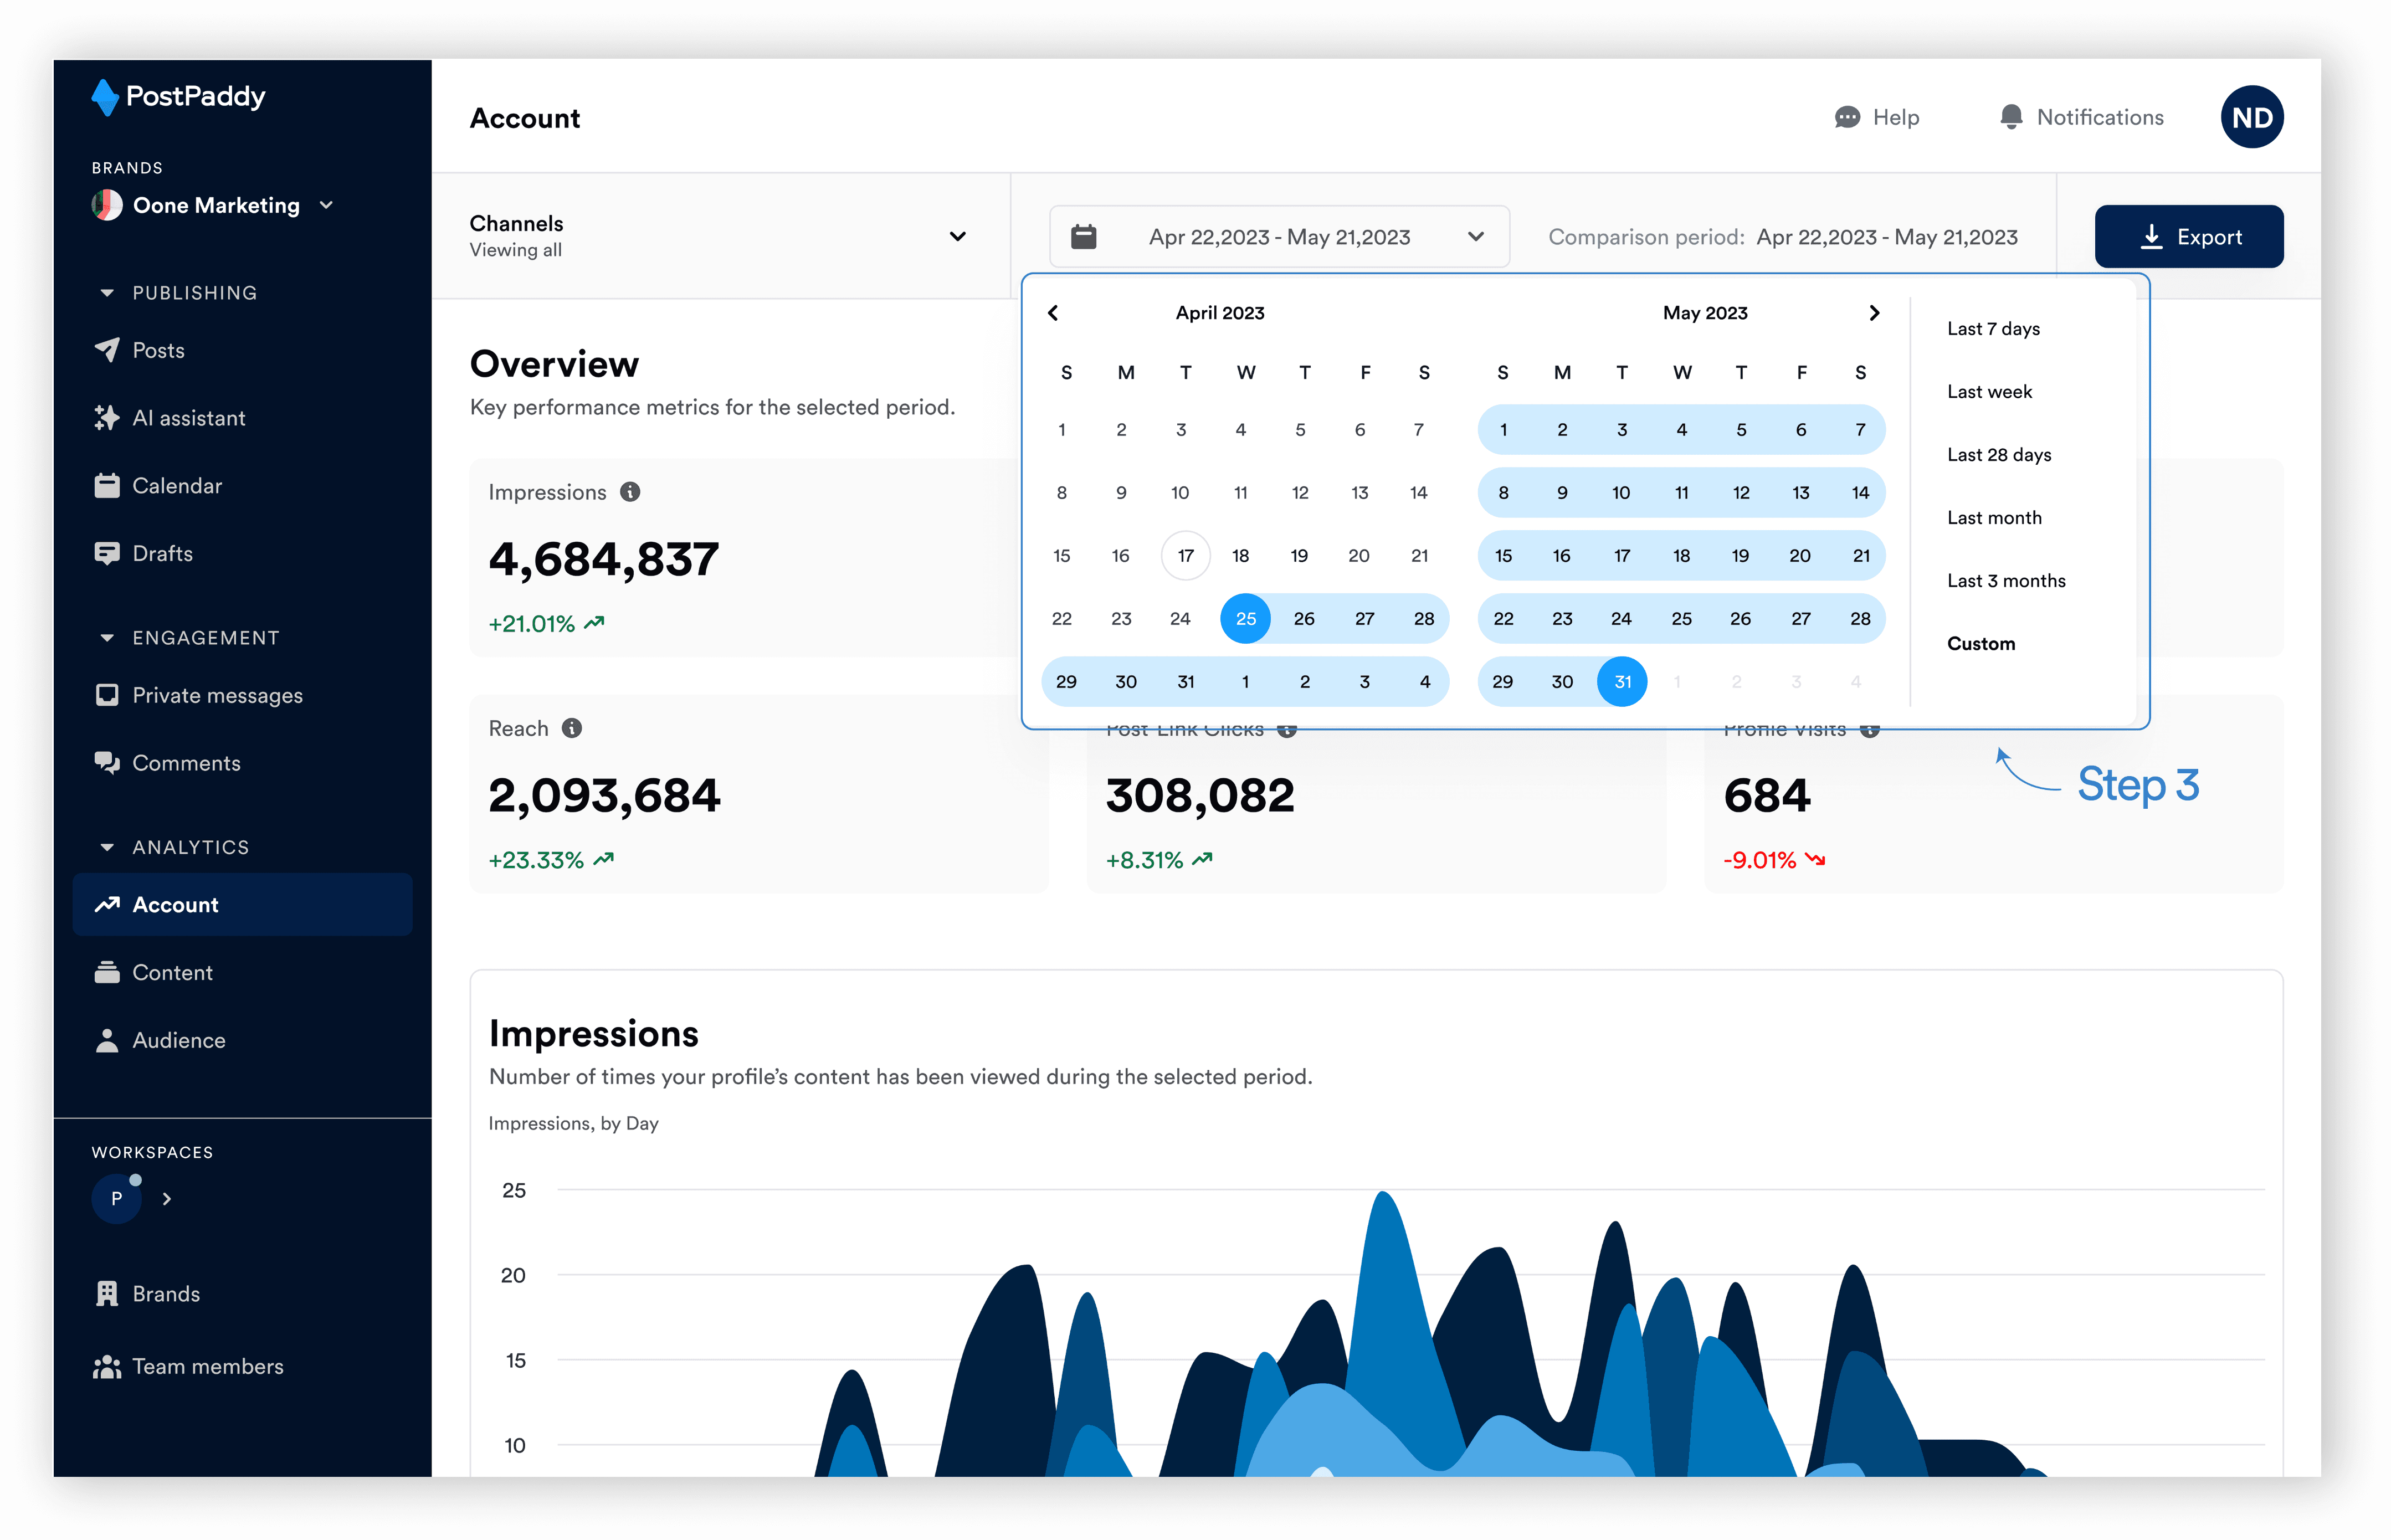
The data will be downloaded on your local device.
How to use the overview screen
To see a summary of all your account metrics on the overview screen, simply do this:
Step 1: Select "Account" on the analytics area of the side navigation bar.
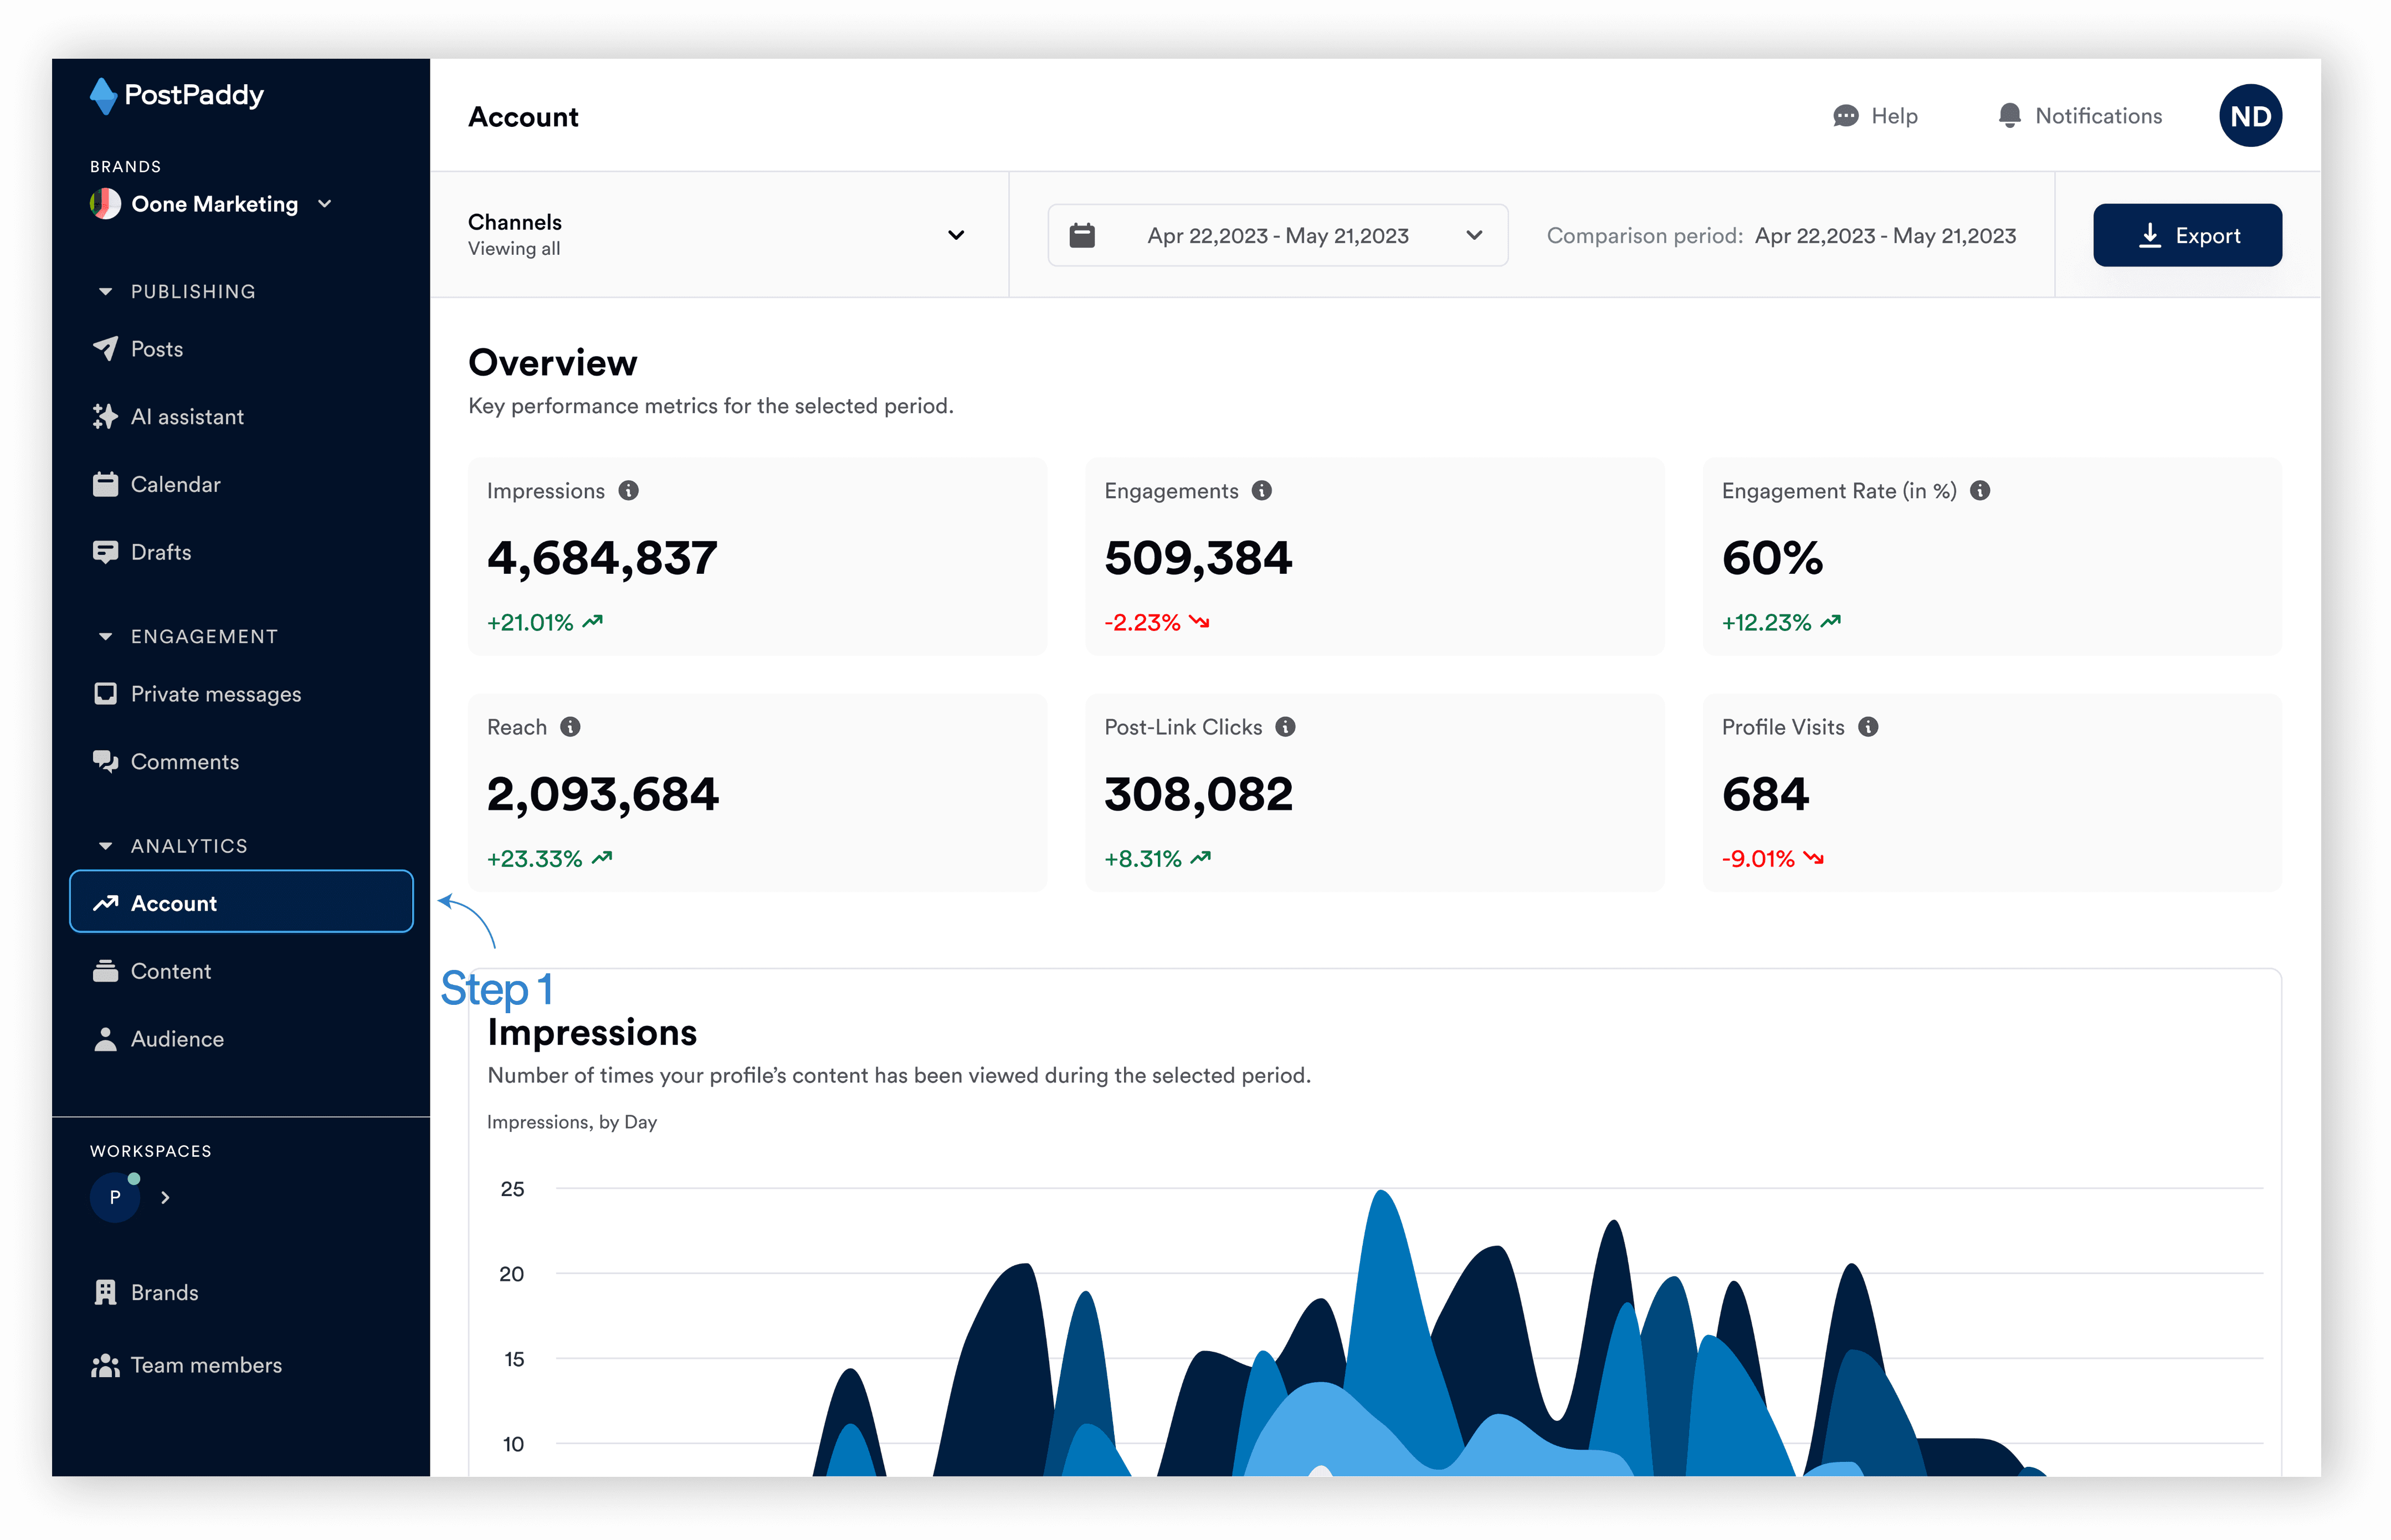
You should see overview data for impressions, engagement, engagement rate, reach, post-link clicks, and profile visits. You can also hover above each item to learn more about the data.
How to use the impressions chart
You can see a chart for impressions on your account(s). Here’s how:
Step 1: Select "Account" on the analytics area of the side navigation bar.
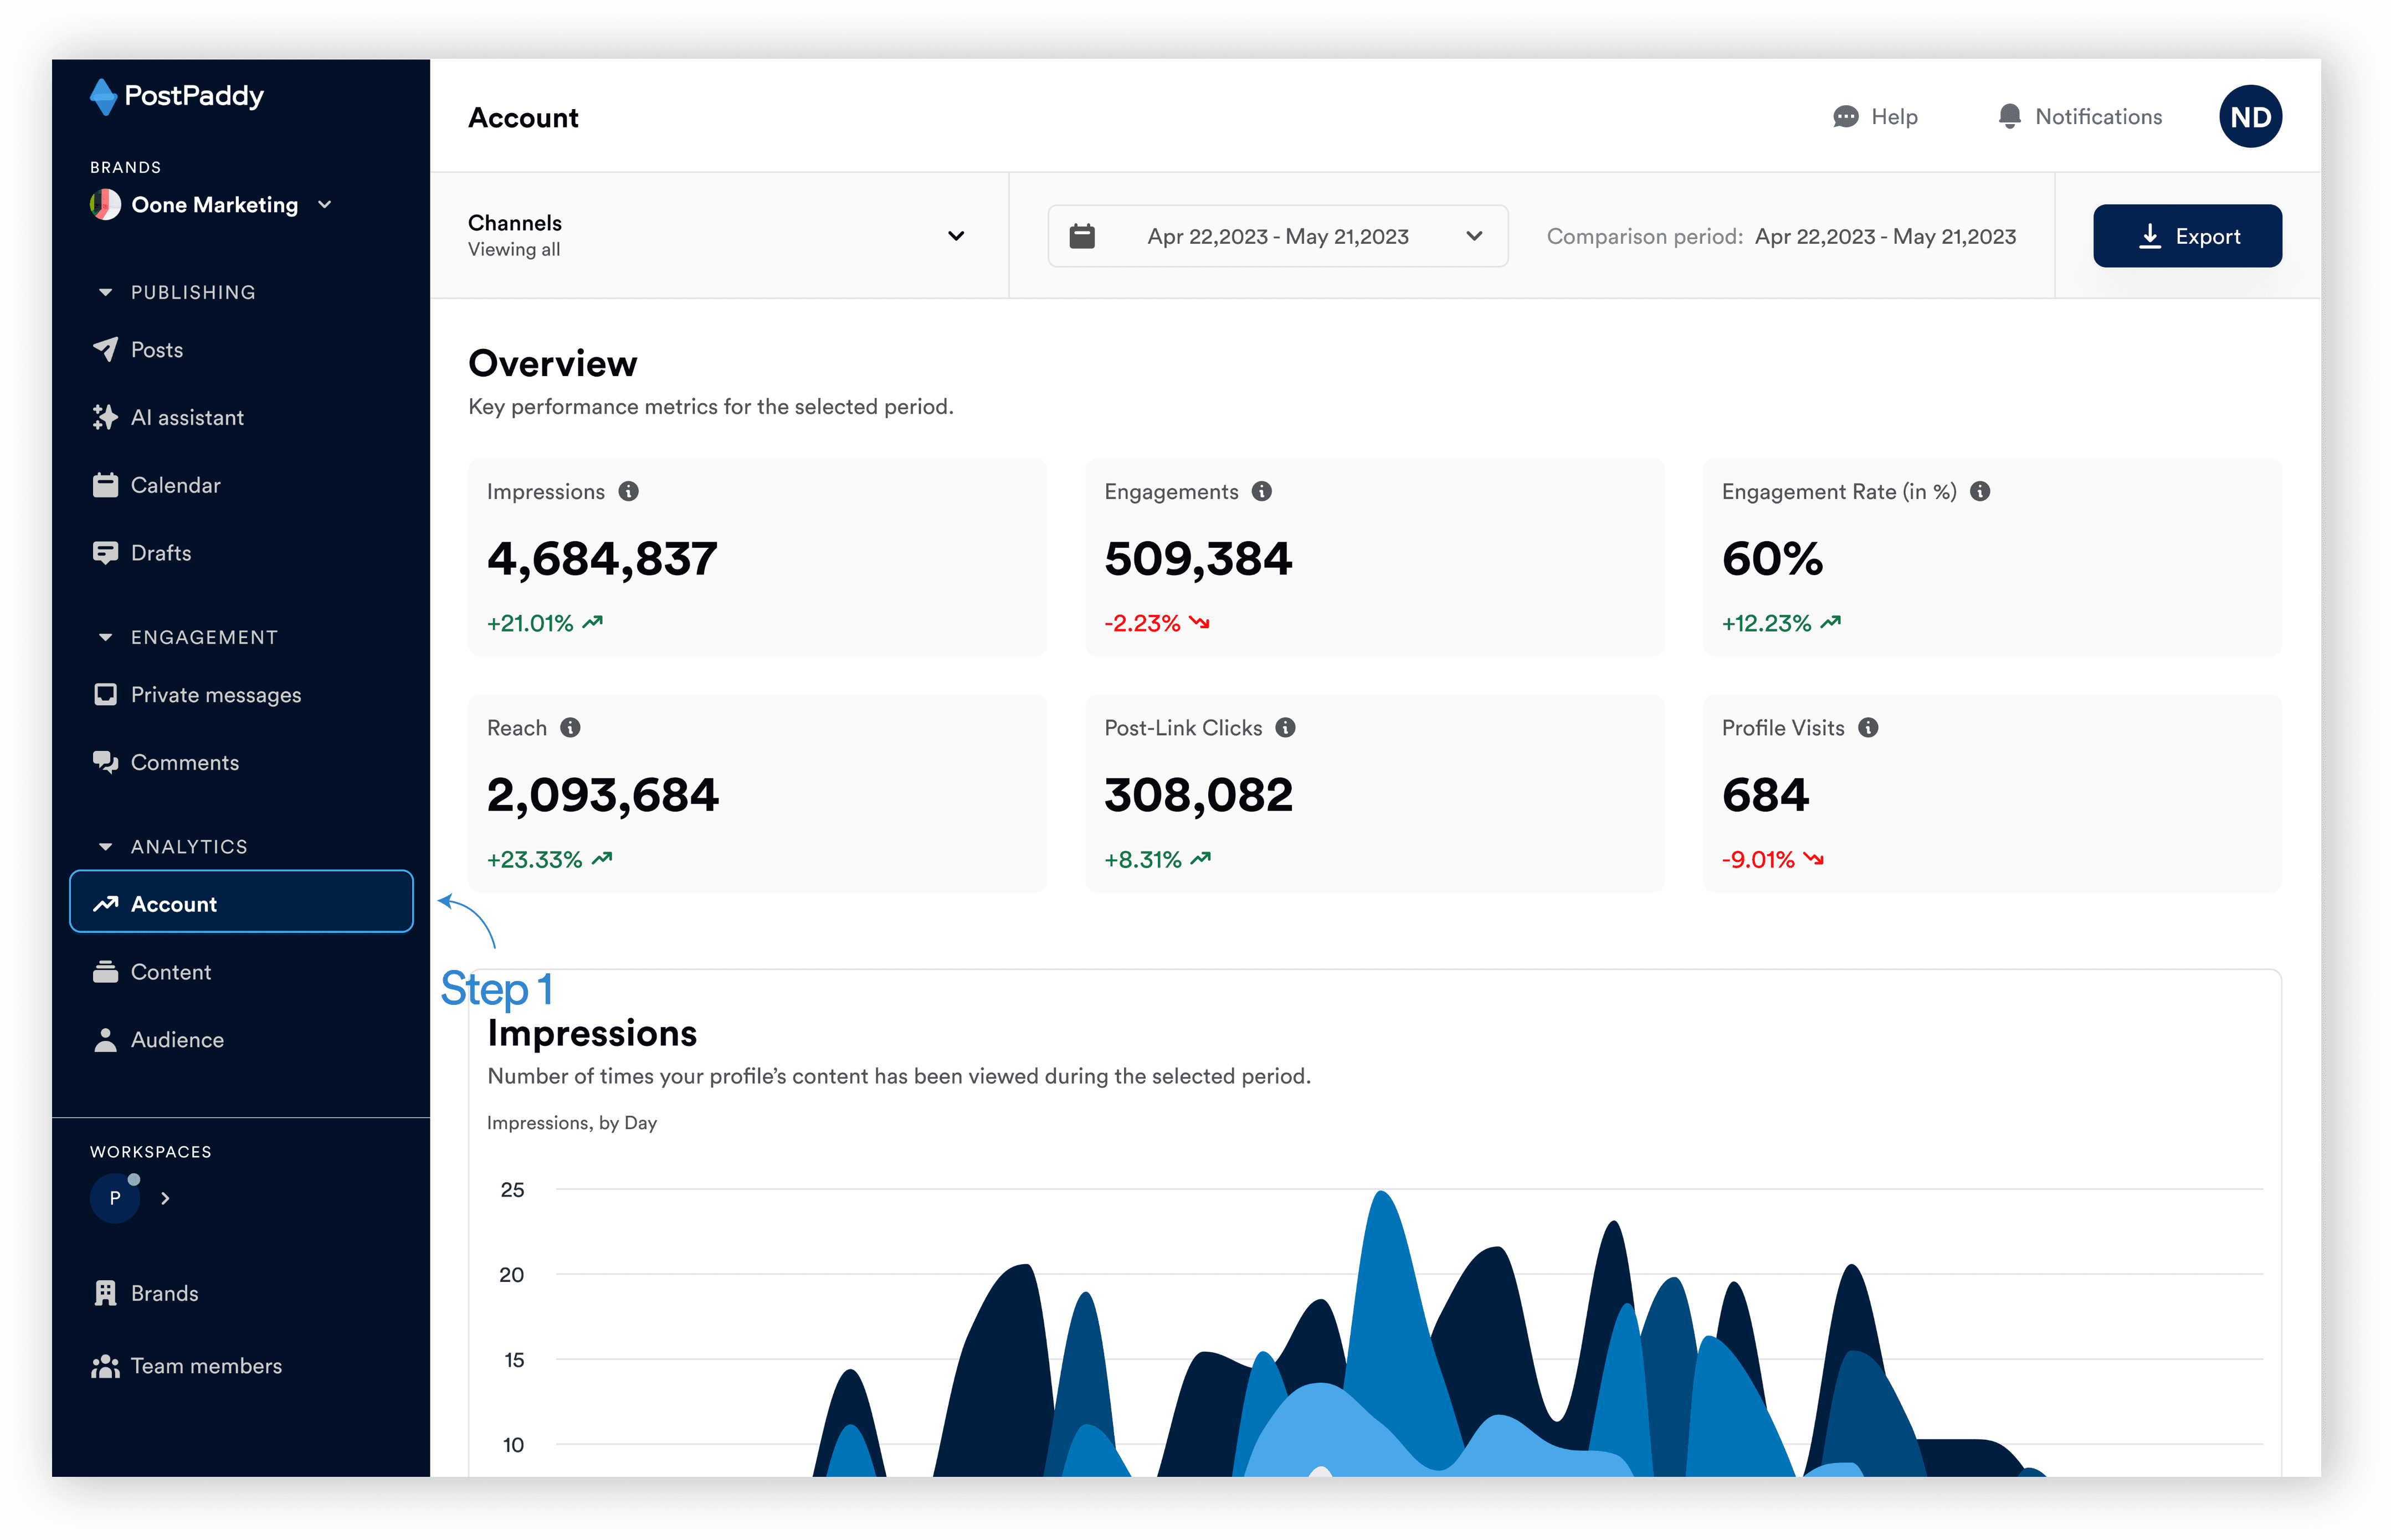
Step 2: Scroll down to the impressions chart area.
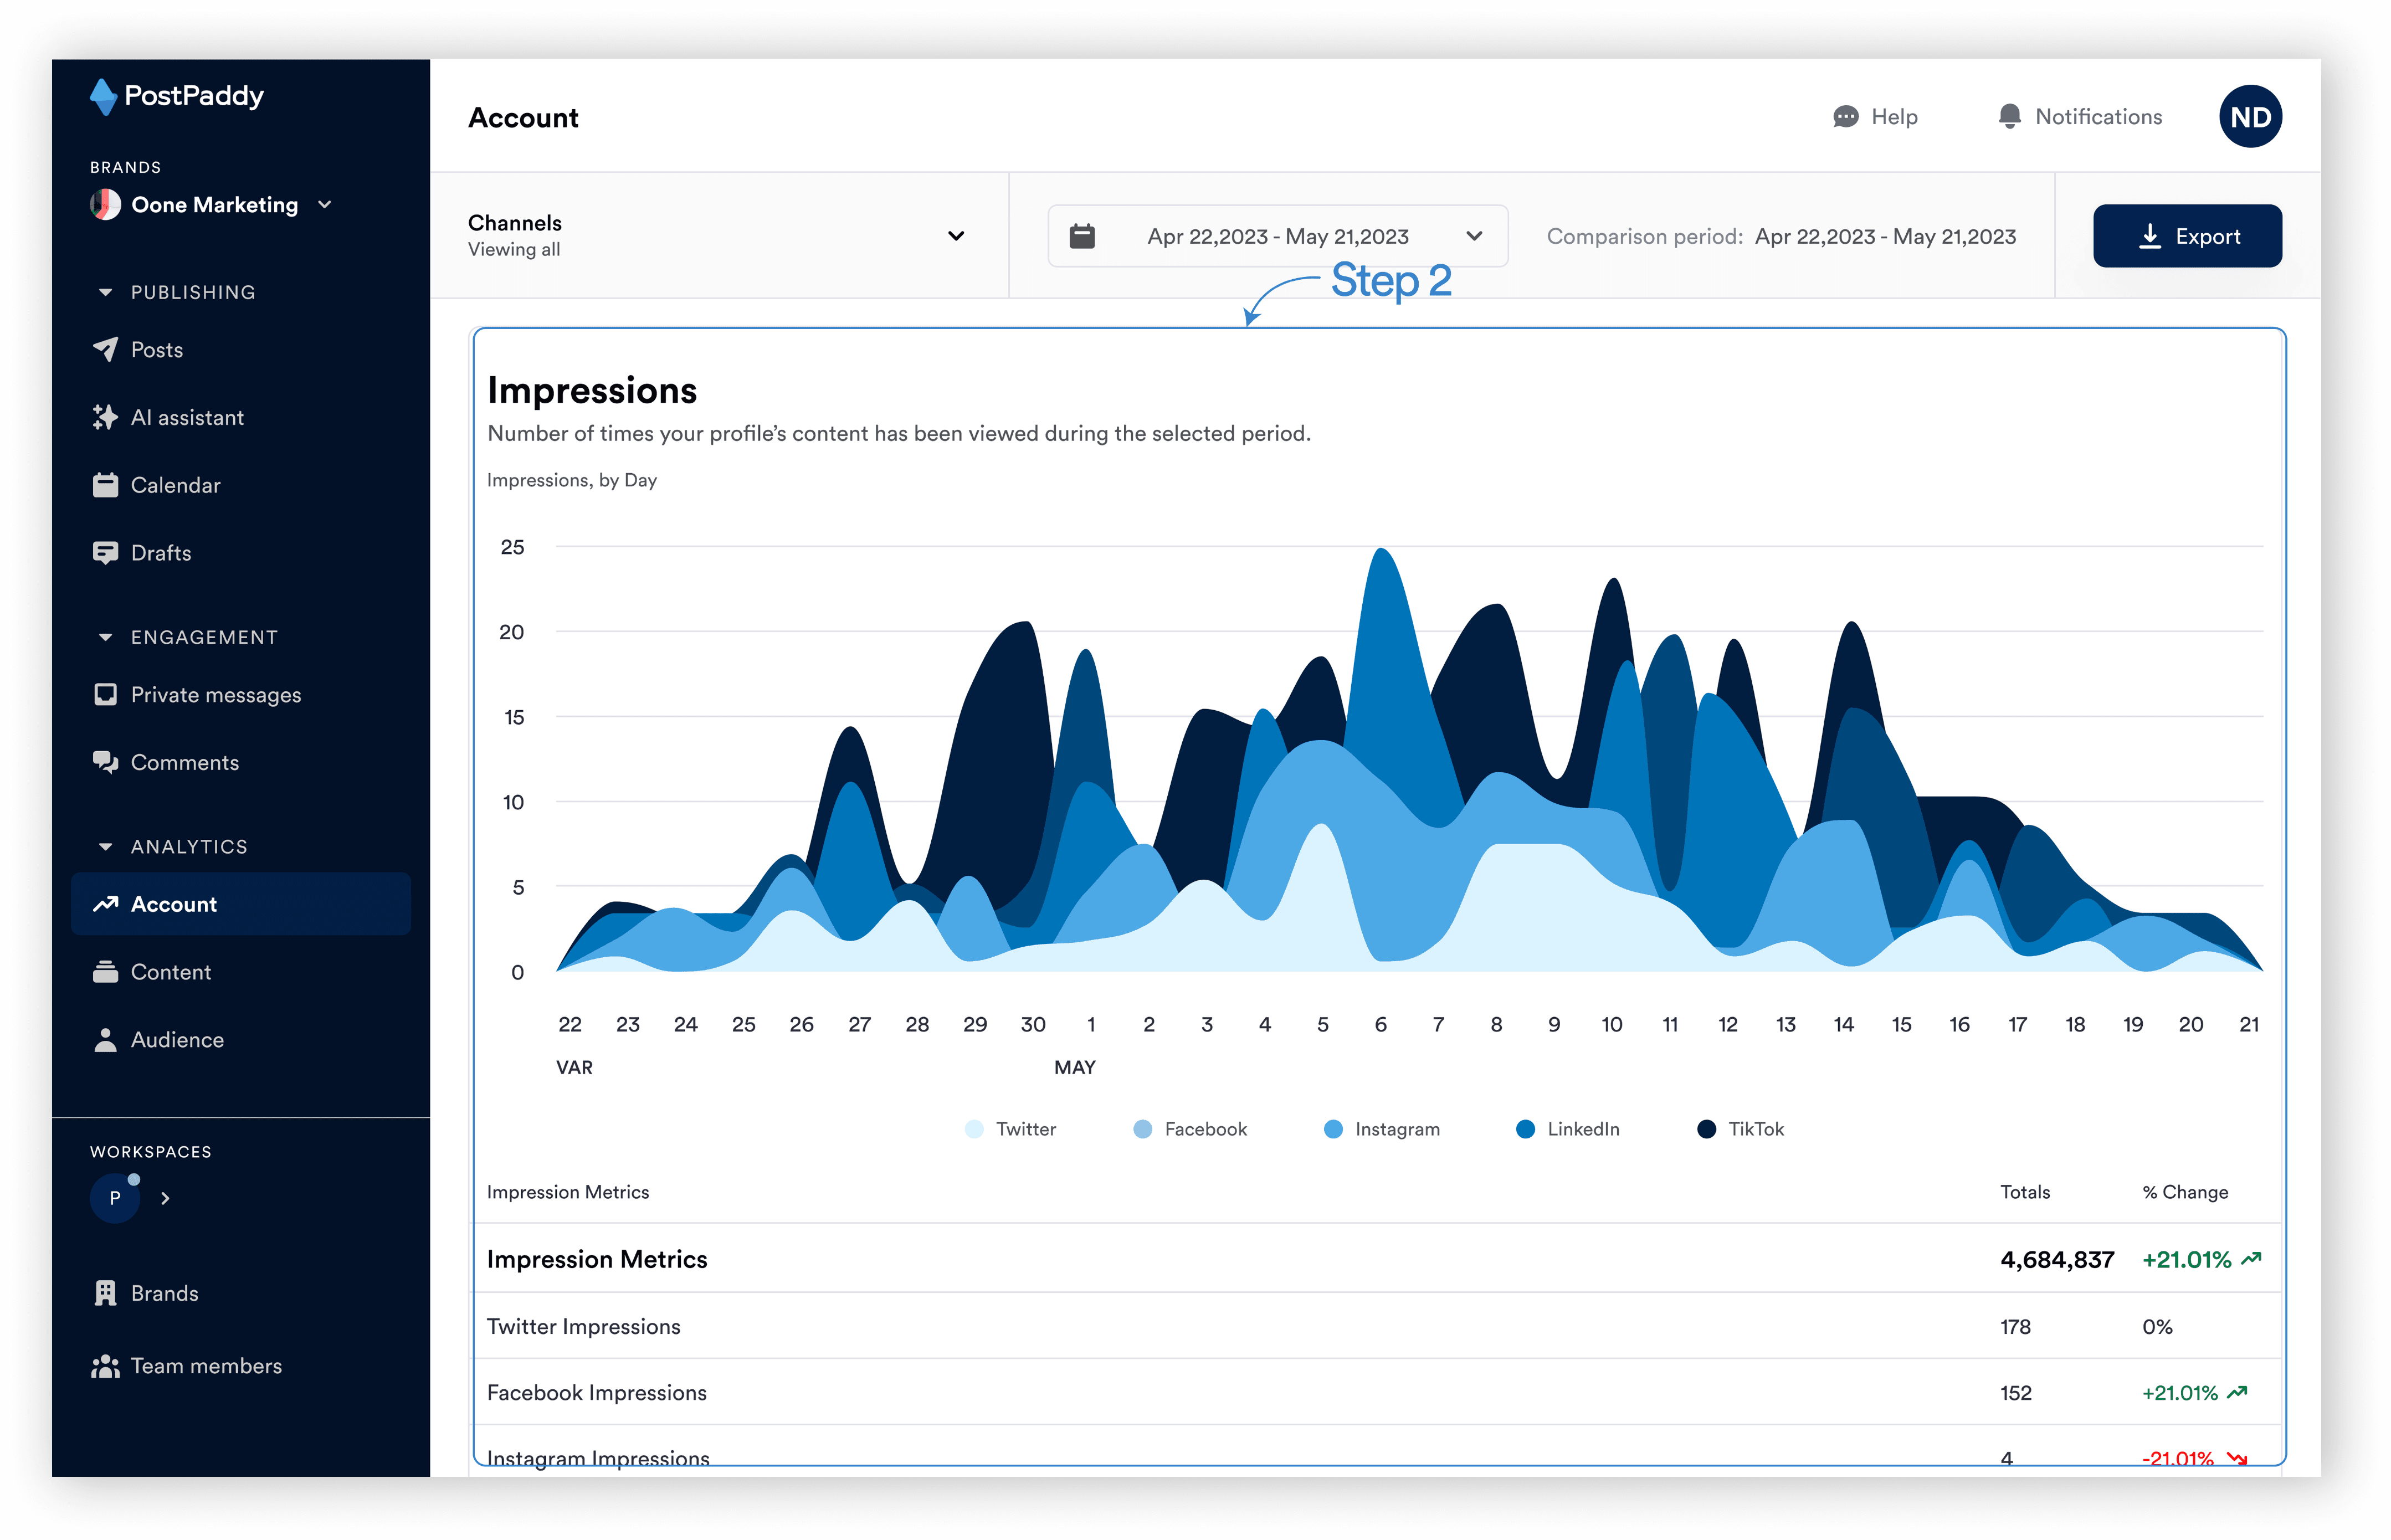
You should see a chart for impressions based on the selected channel. You can also hover over each area on the chart to see the specific impressions for that time.
How to use the engagement chart
You can see a chart for engagements on your account(s). Here’s how:
Step 1: Select "Account" on the analytics area of the side navigation bar.
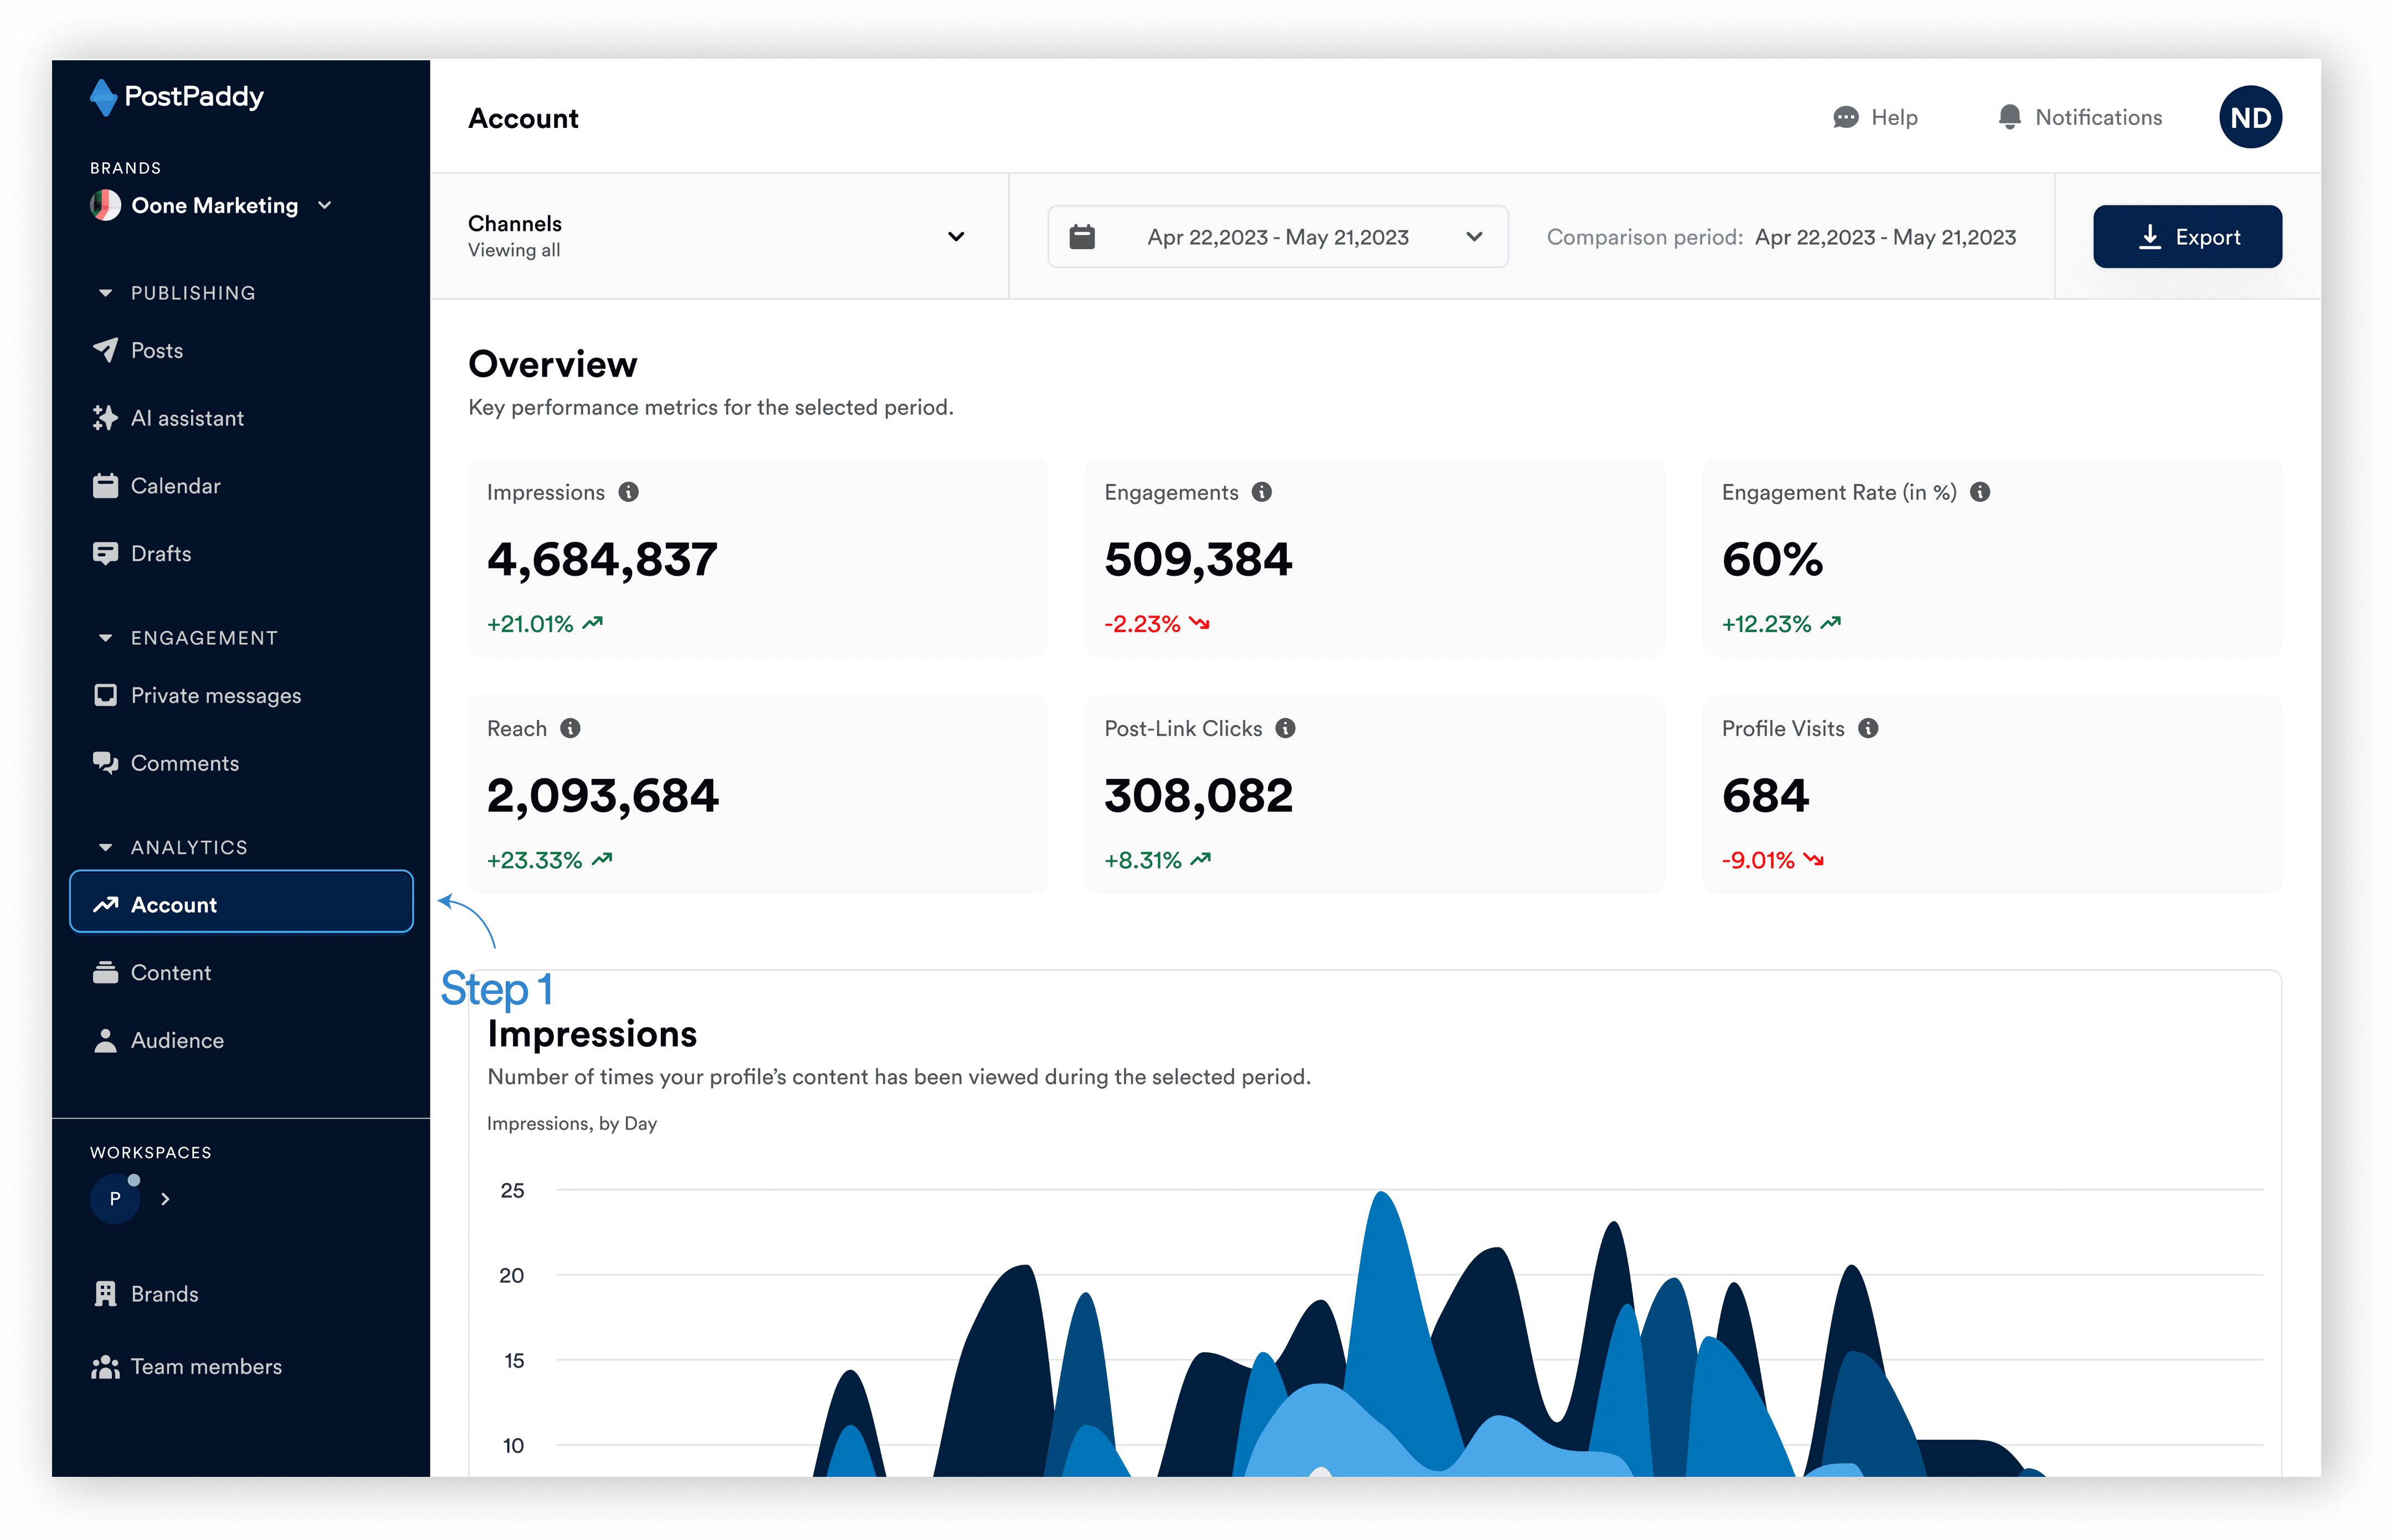
Step 2: Scroll down to the engagements chart area.
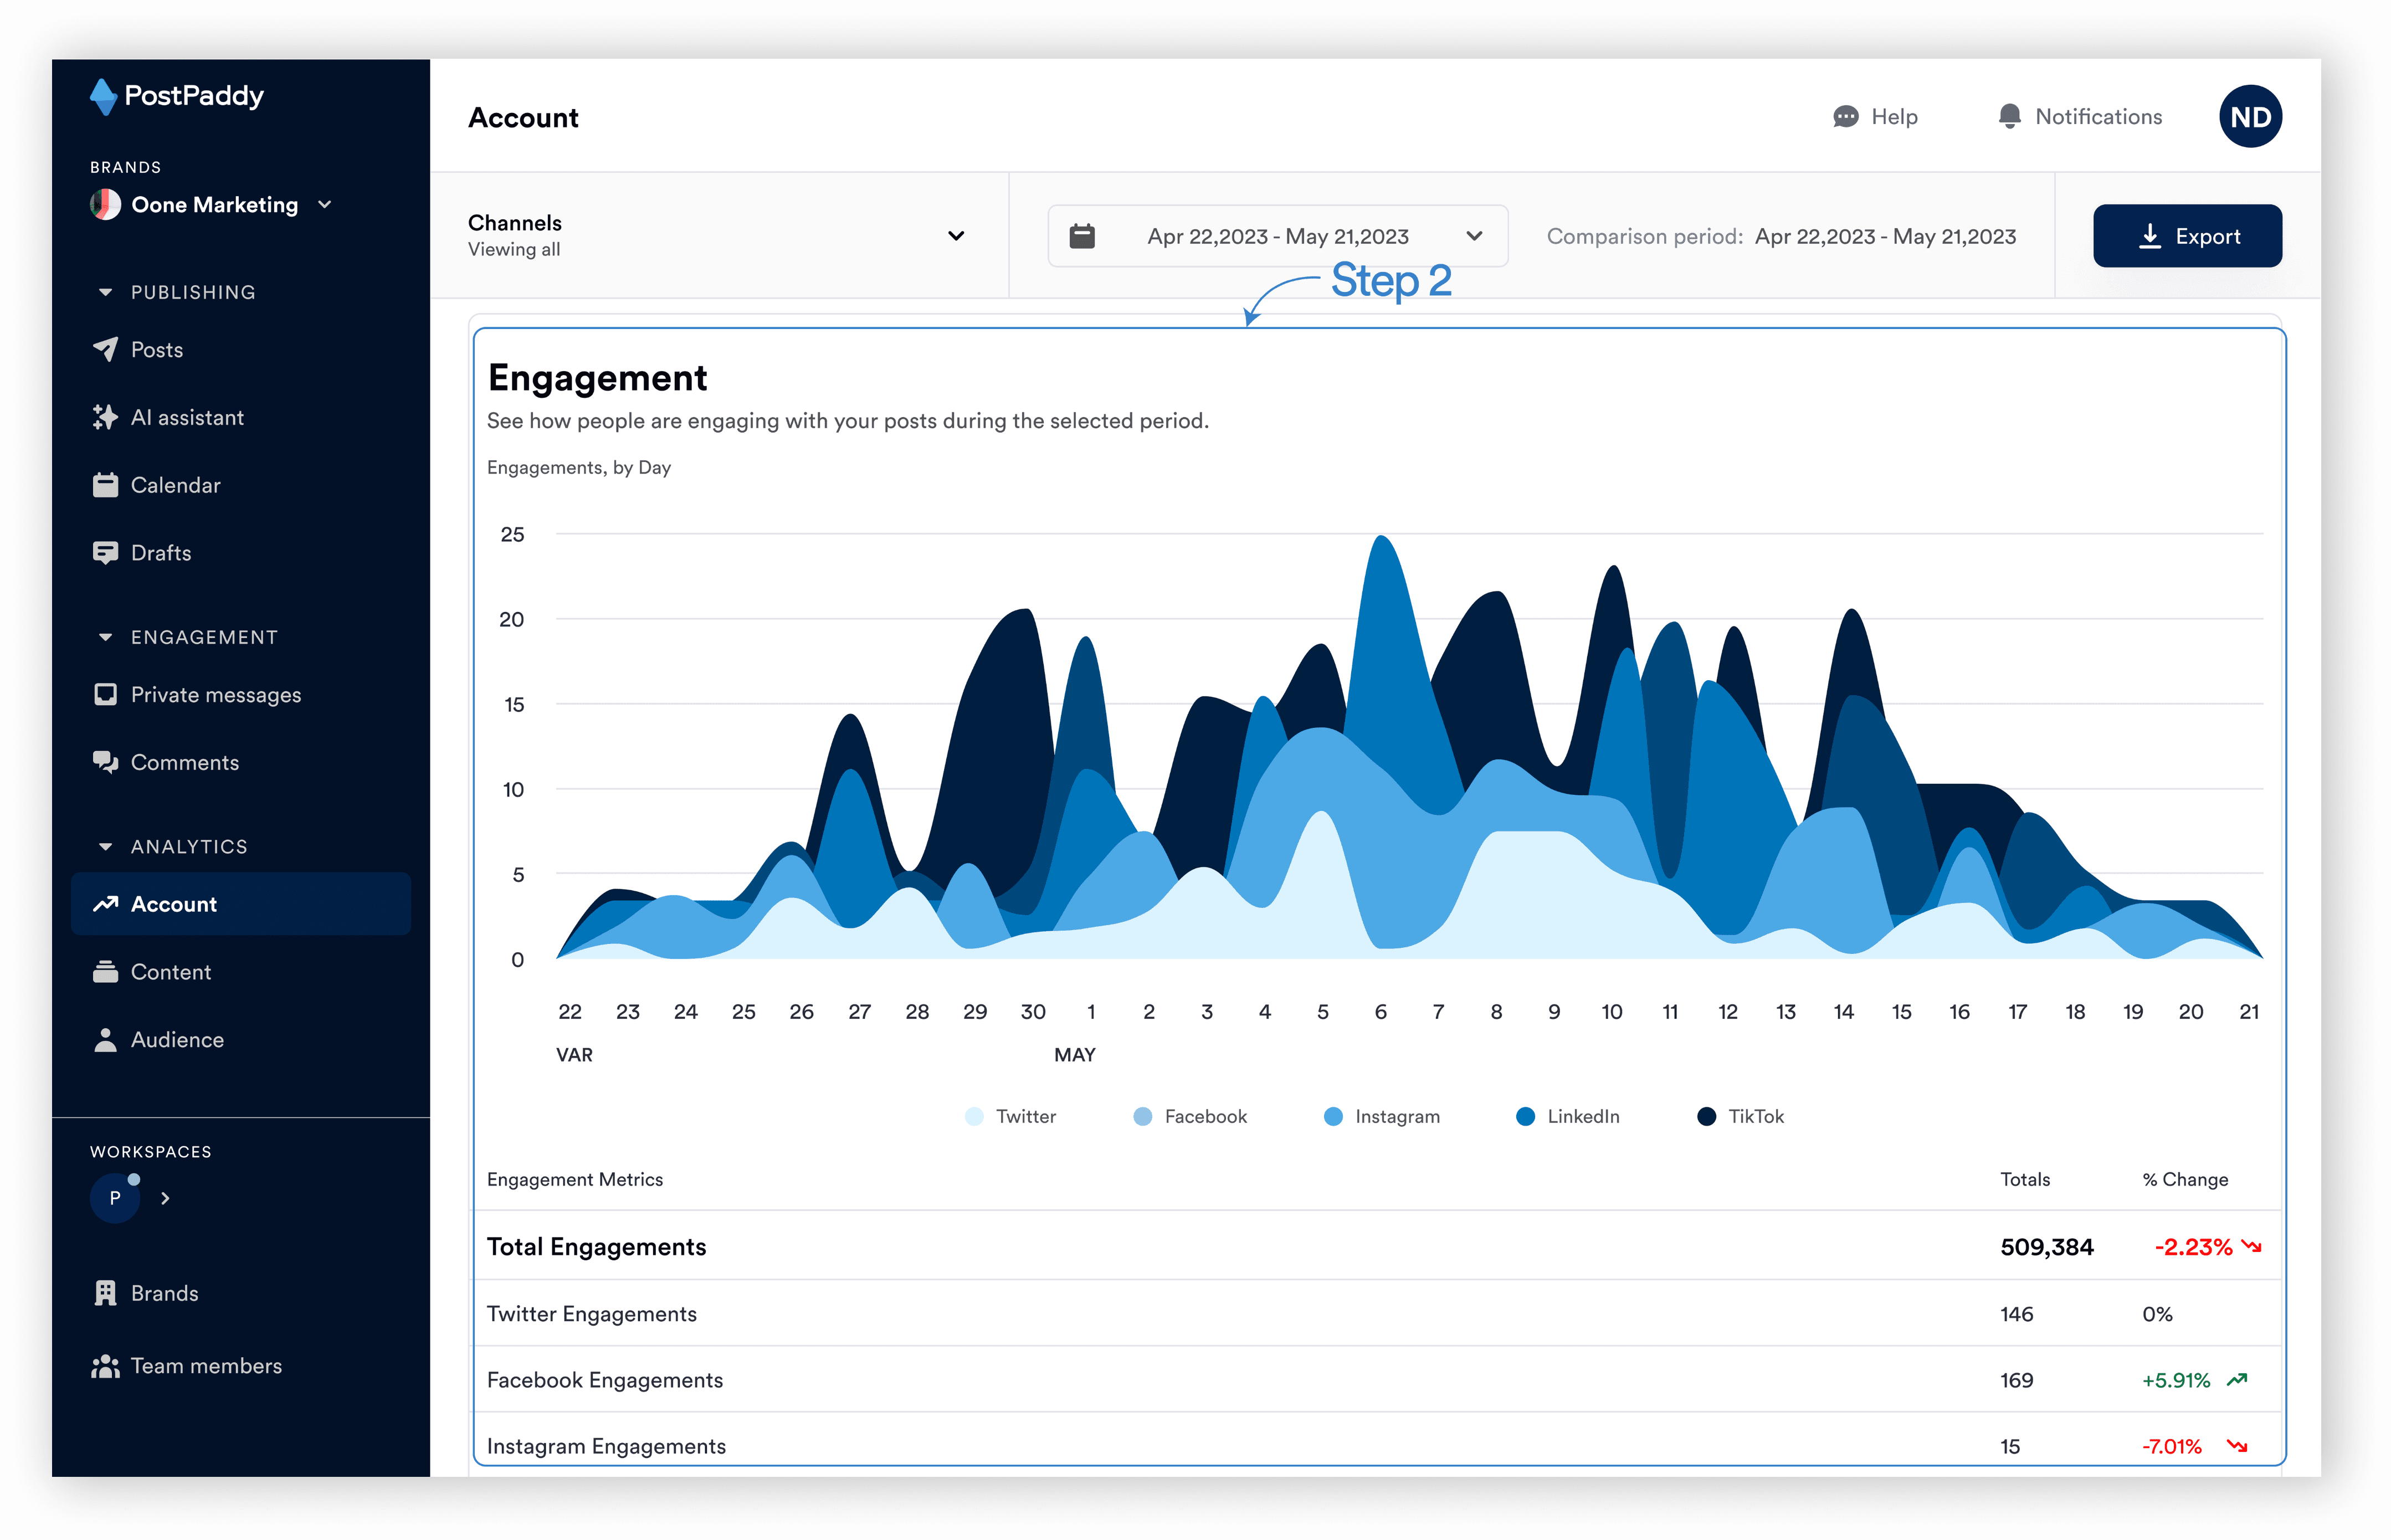
You will see a chart for engagements based on the selected channel. You can also hover above each area of the chart to see the specific engagements for that time.
How to use the engagement rate chart
You can see a chart for the account(s) engagement rate.
Step 1: Select "Account" on the analytics area of the side navigation bar.

Step 2: Scroll down to the engagements rate chart area.
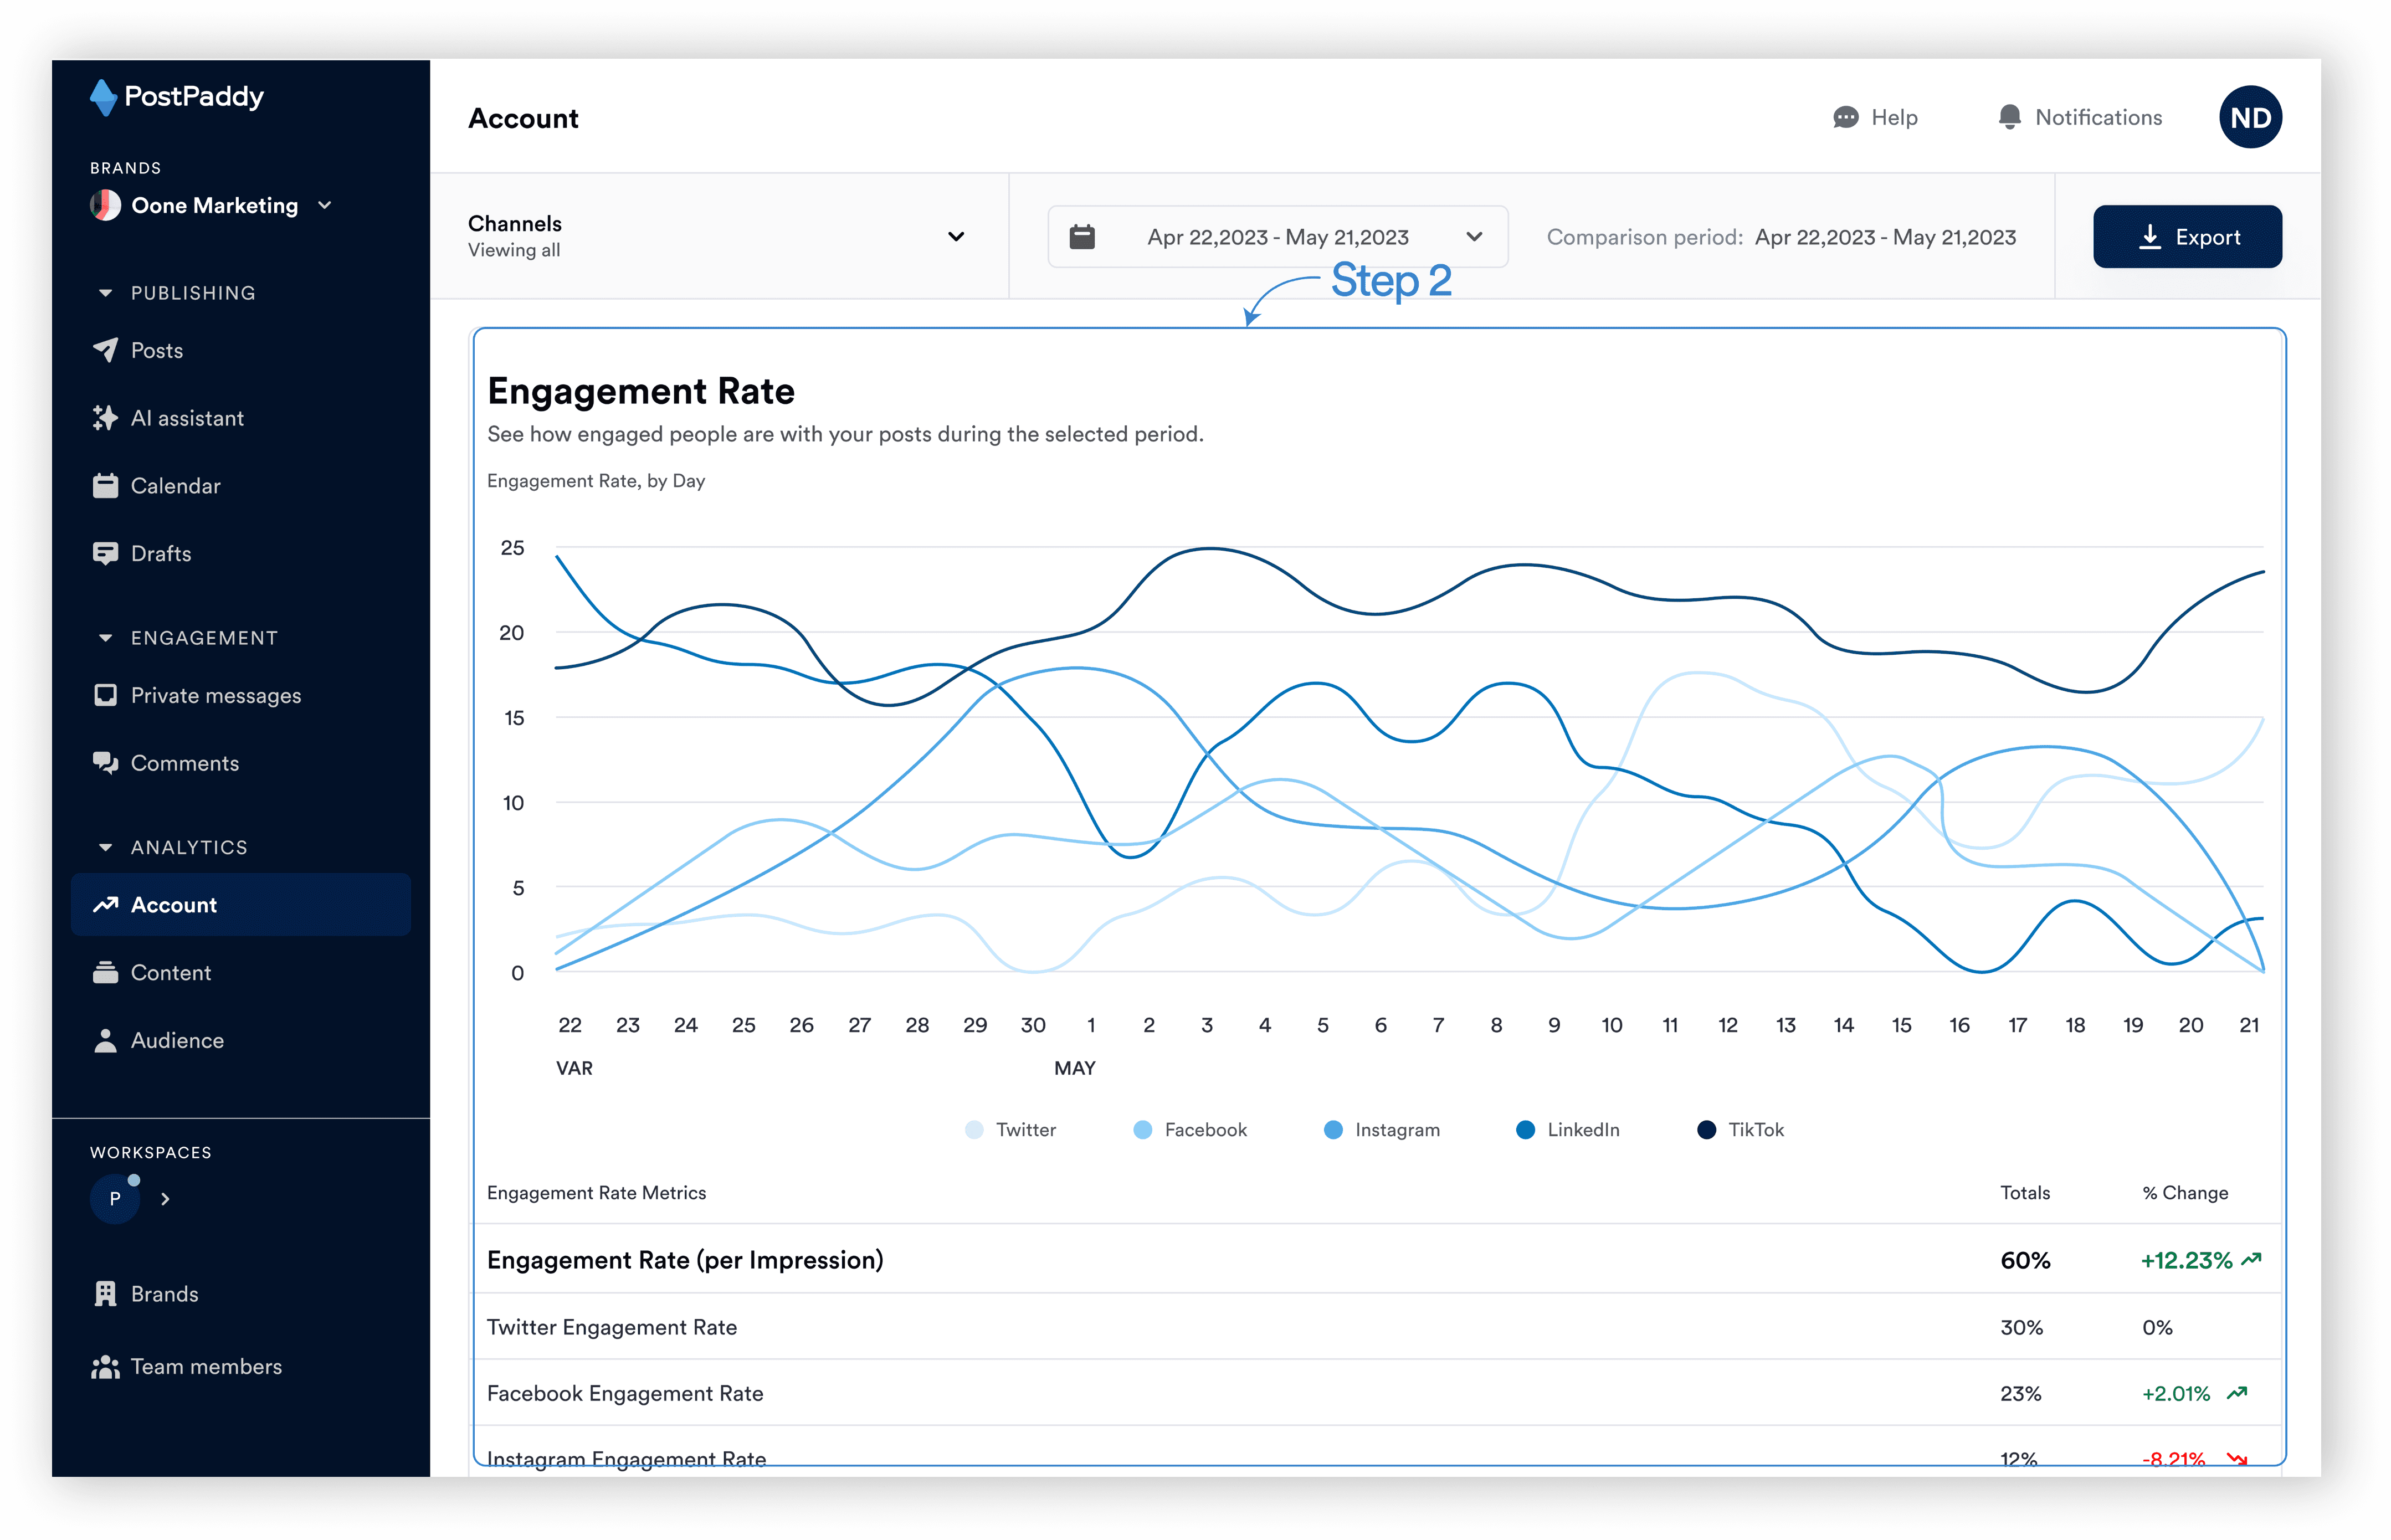
You will see a chart for engagement rates based on the selected channel. You can also hover over each area of the chart to see the specific engagement rate for that time.
How to check video views
You can see a chart for video views on your account(s). Here’s how:
Step 1: Select "Account" on the analytics area of the side navigation bar.

Step 2: Scroll down to the video views chart area.
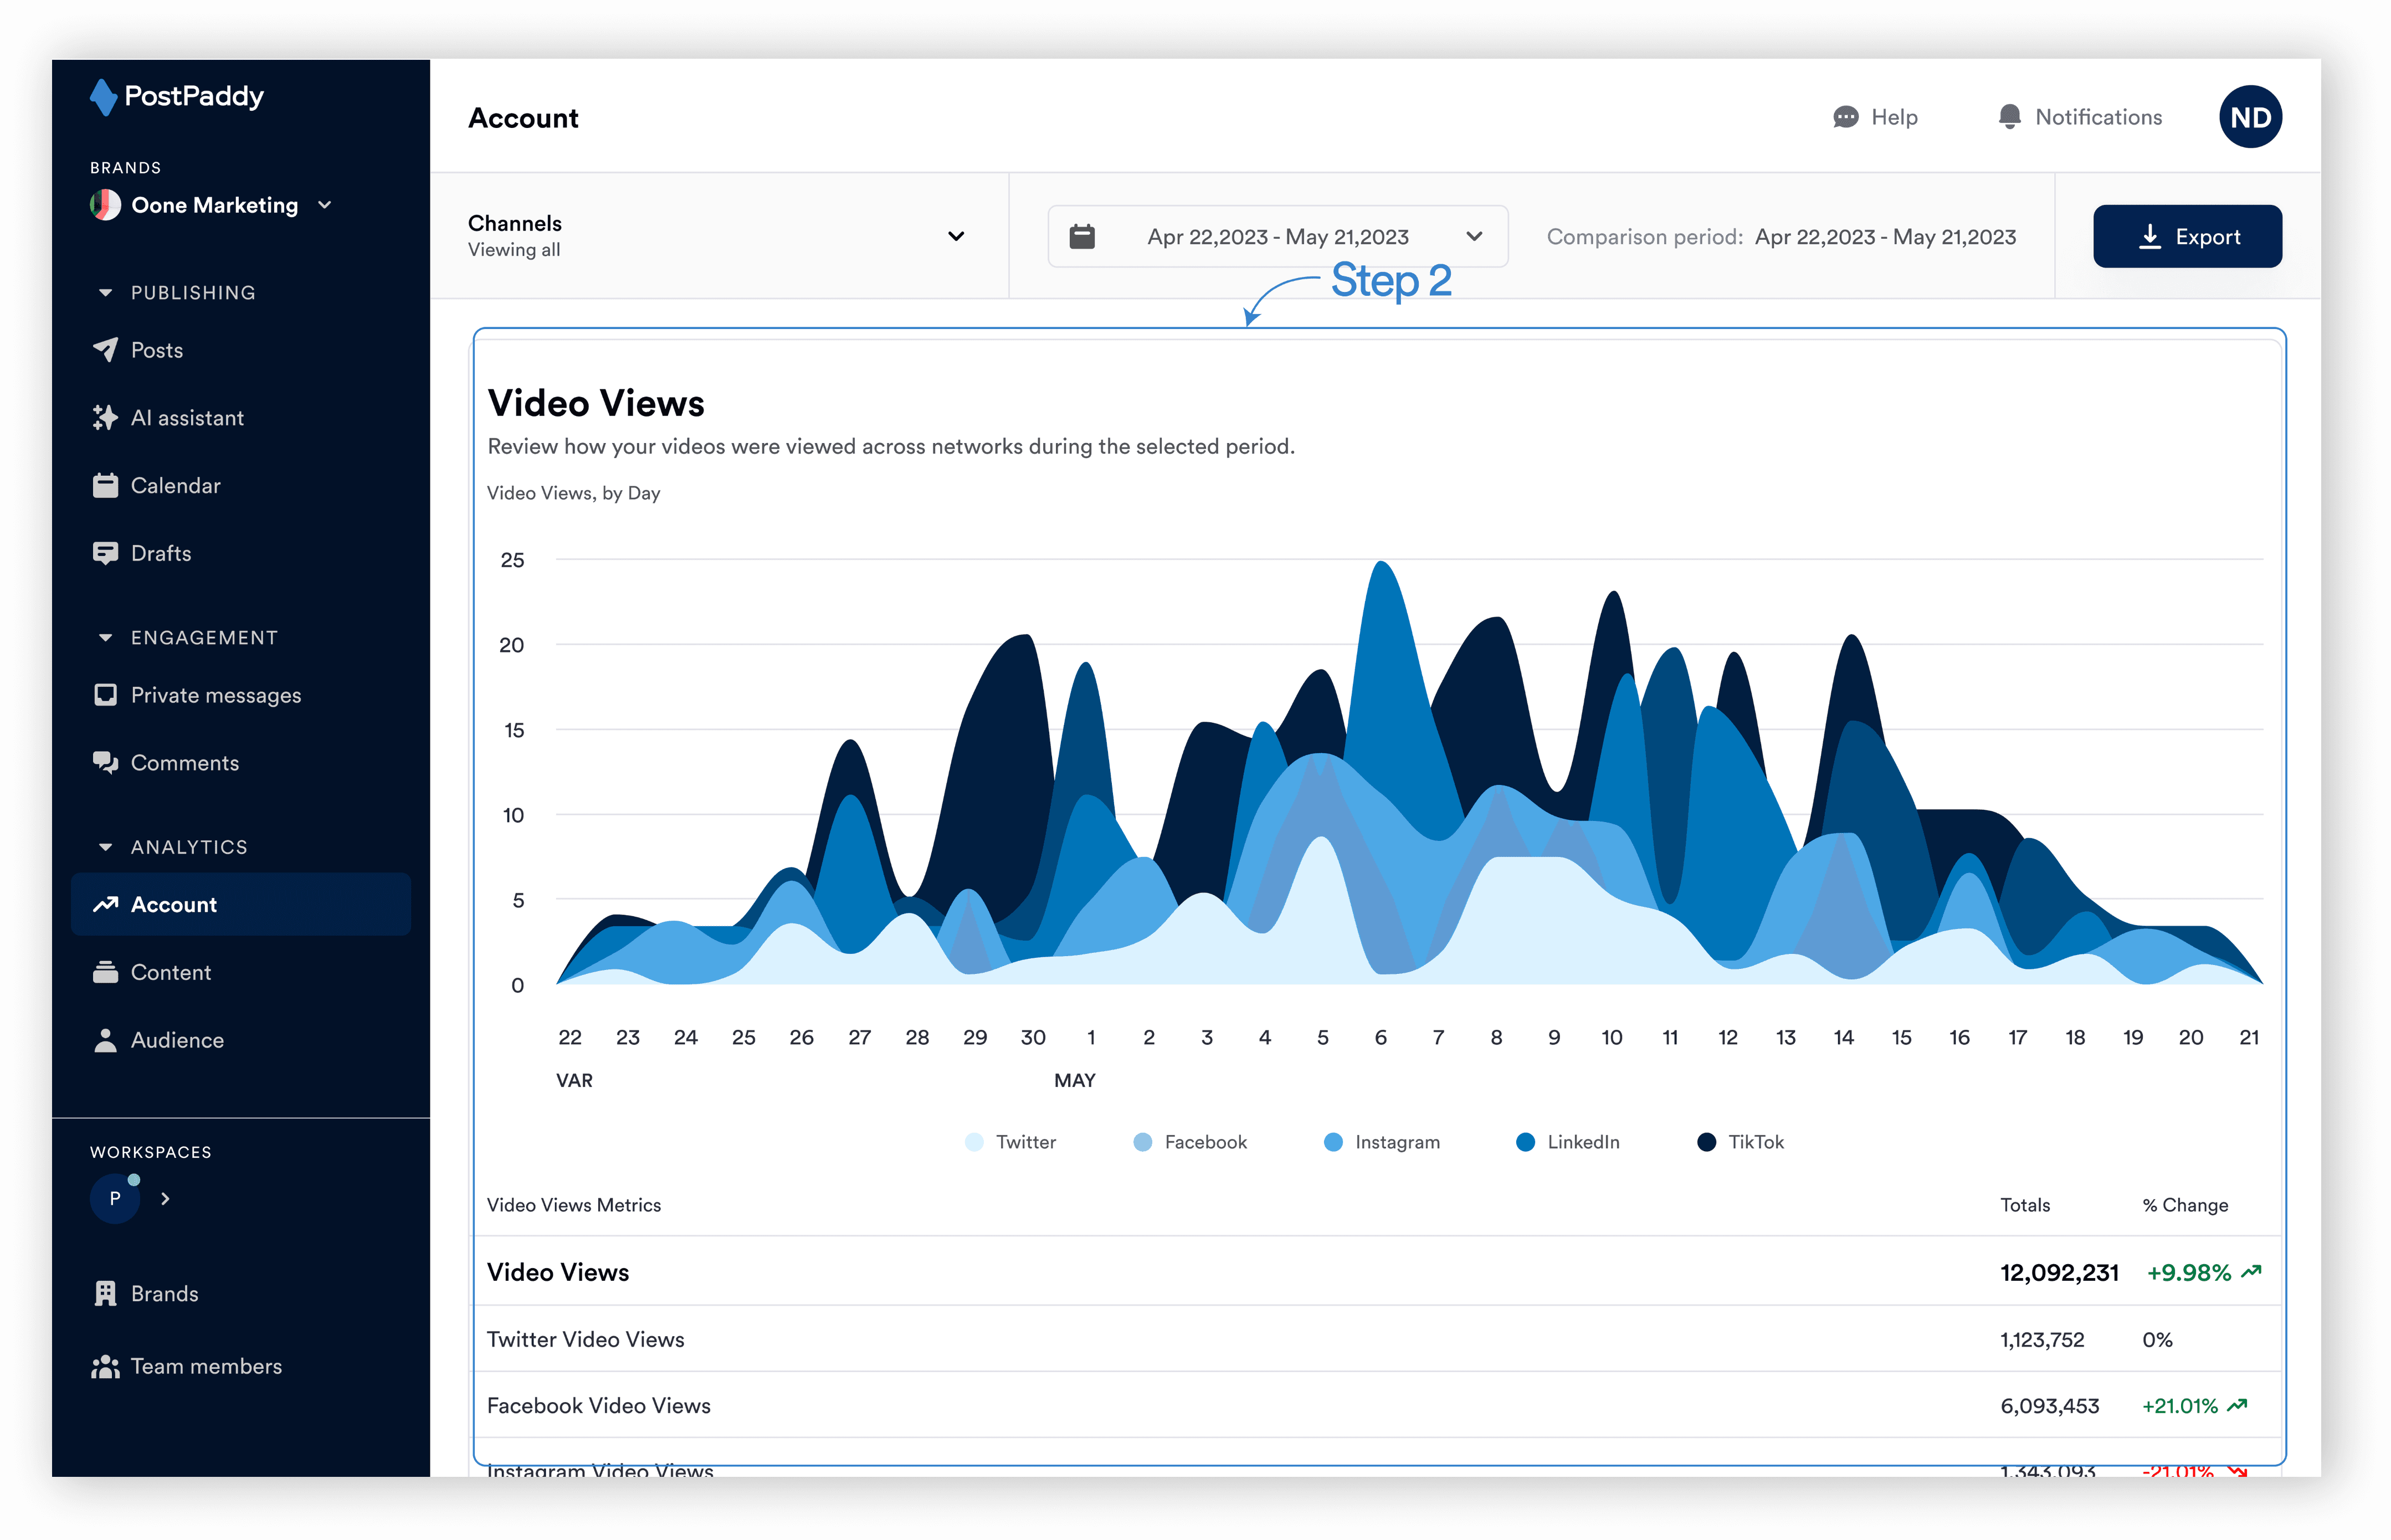
You should see a chart for video views based on the selected channel.