How to change your data source
You can change the social media channels from which your content analytics data is sourced. Here’s how:
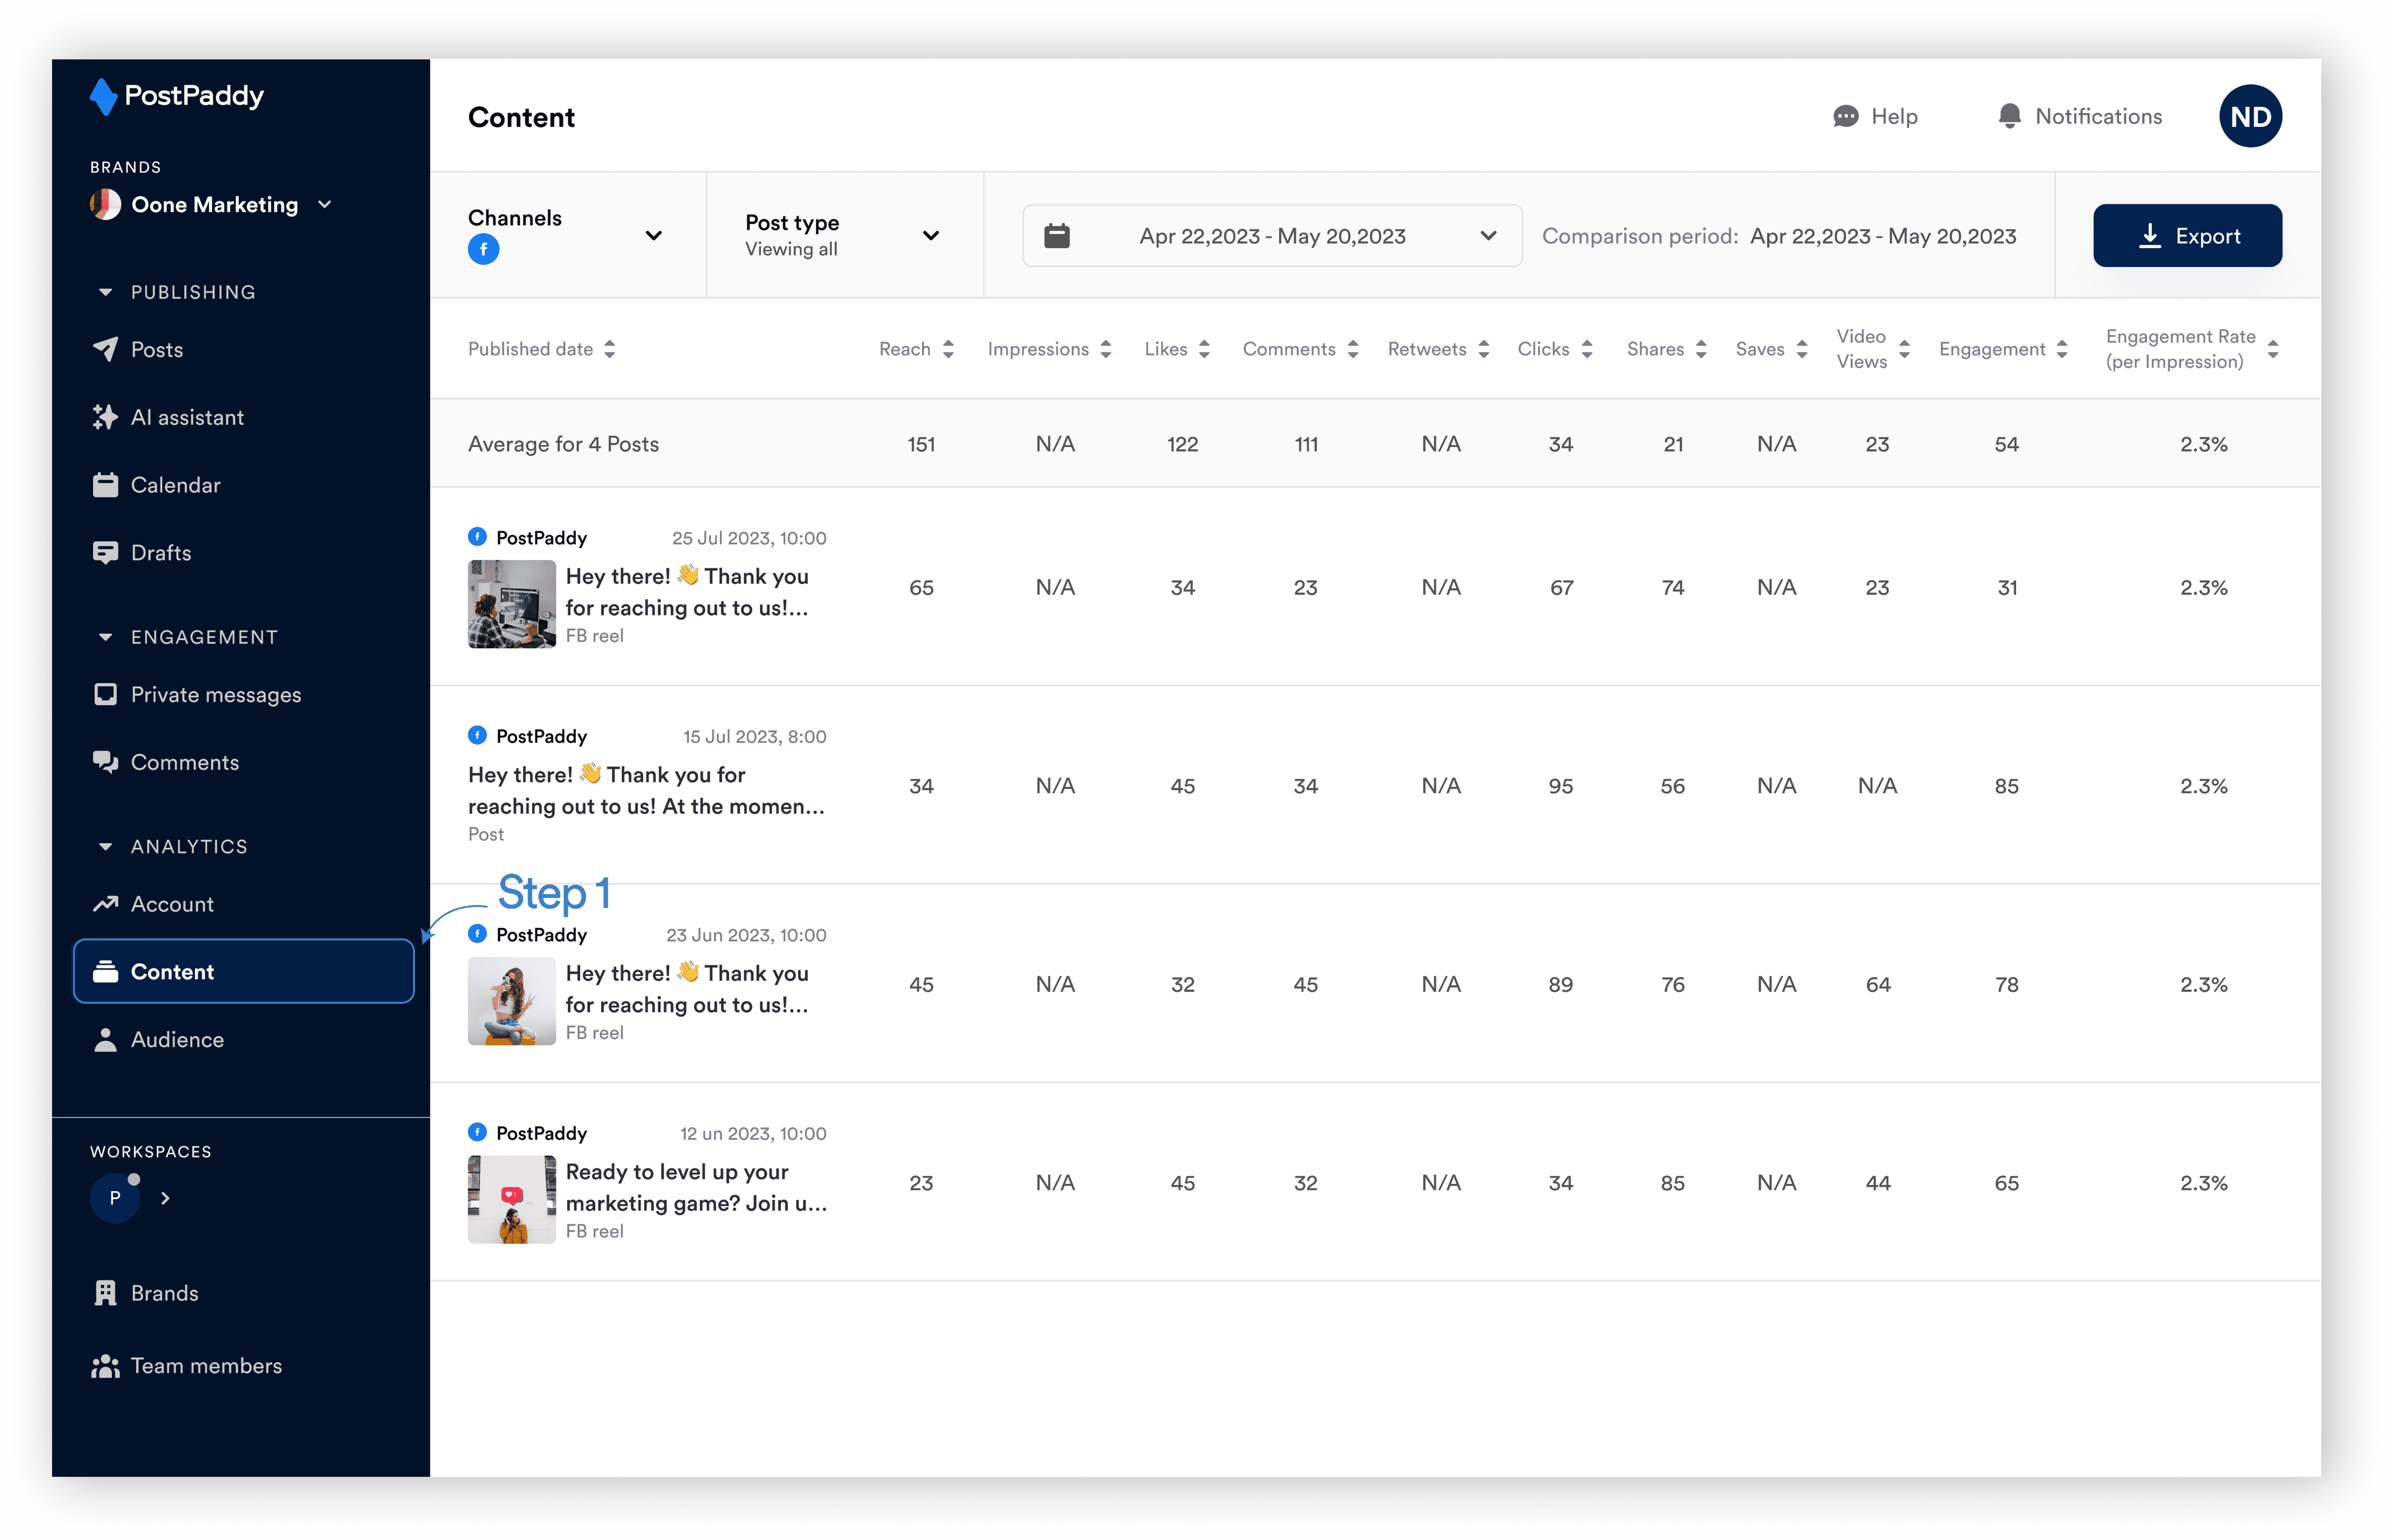
Step 1: Select "Content" on the analytics area of the side navigation bar.
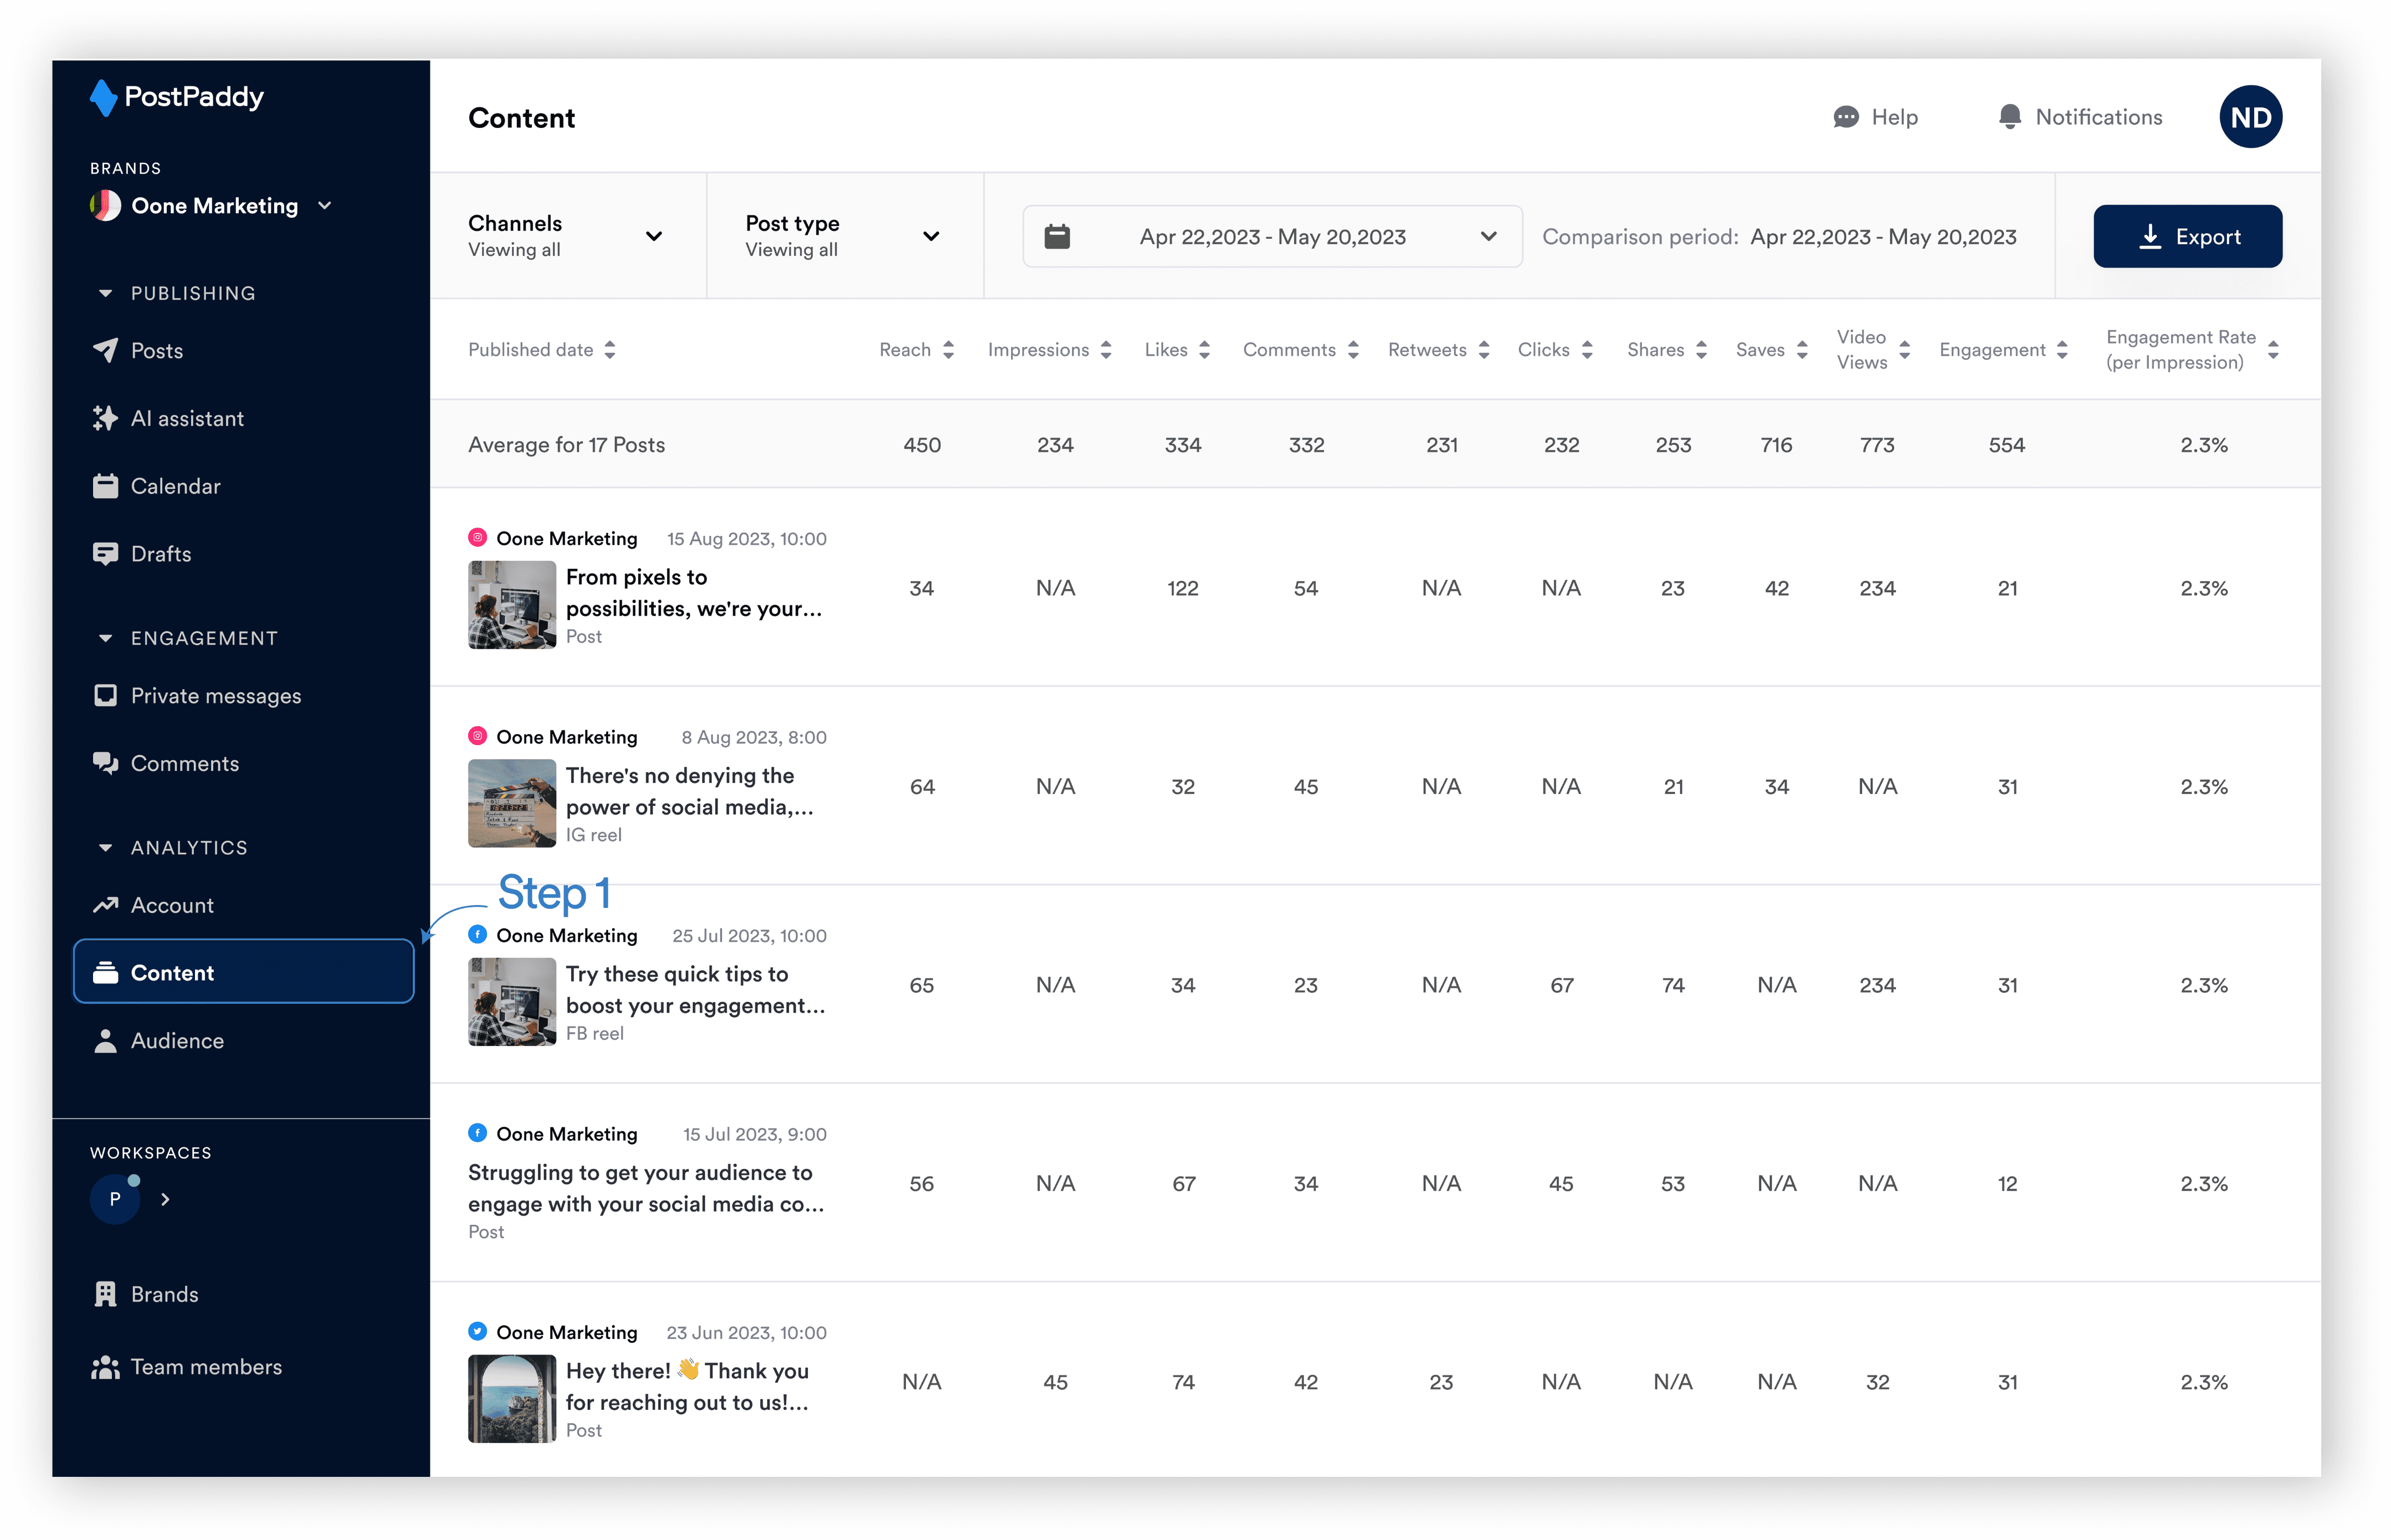
Step 2: Click the channel drop-down.
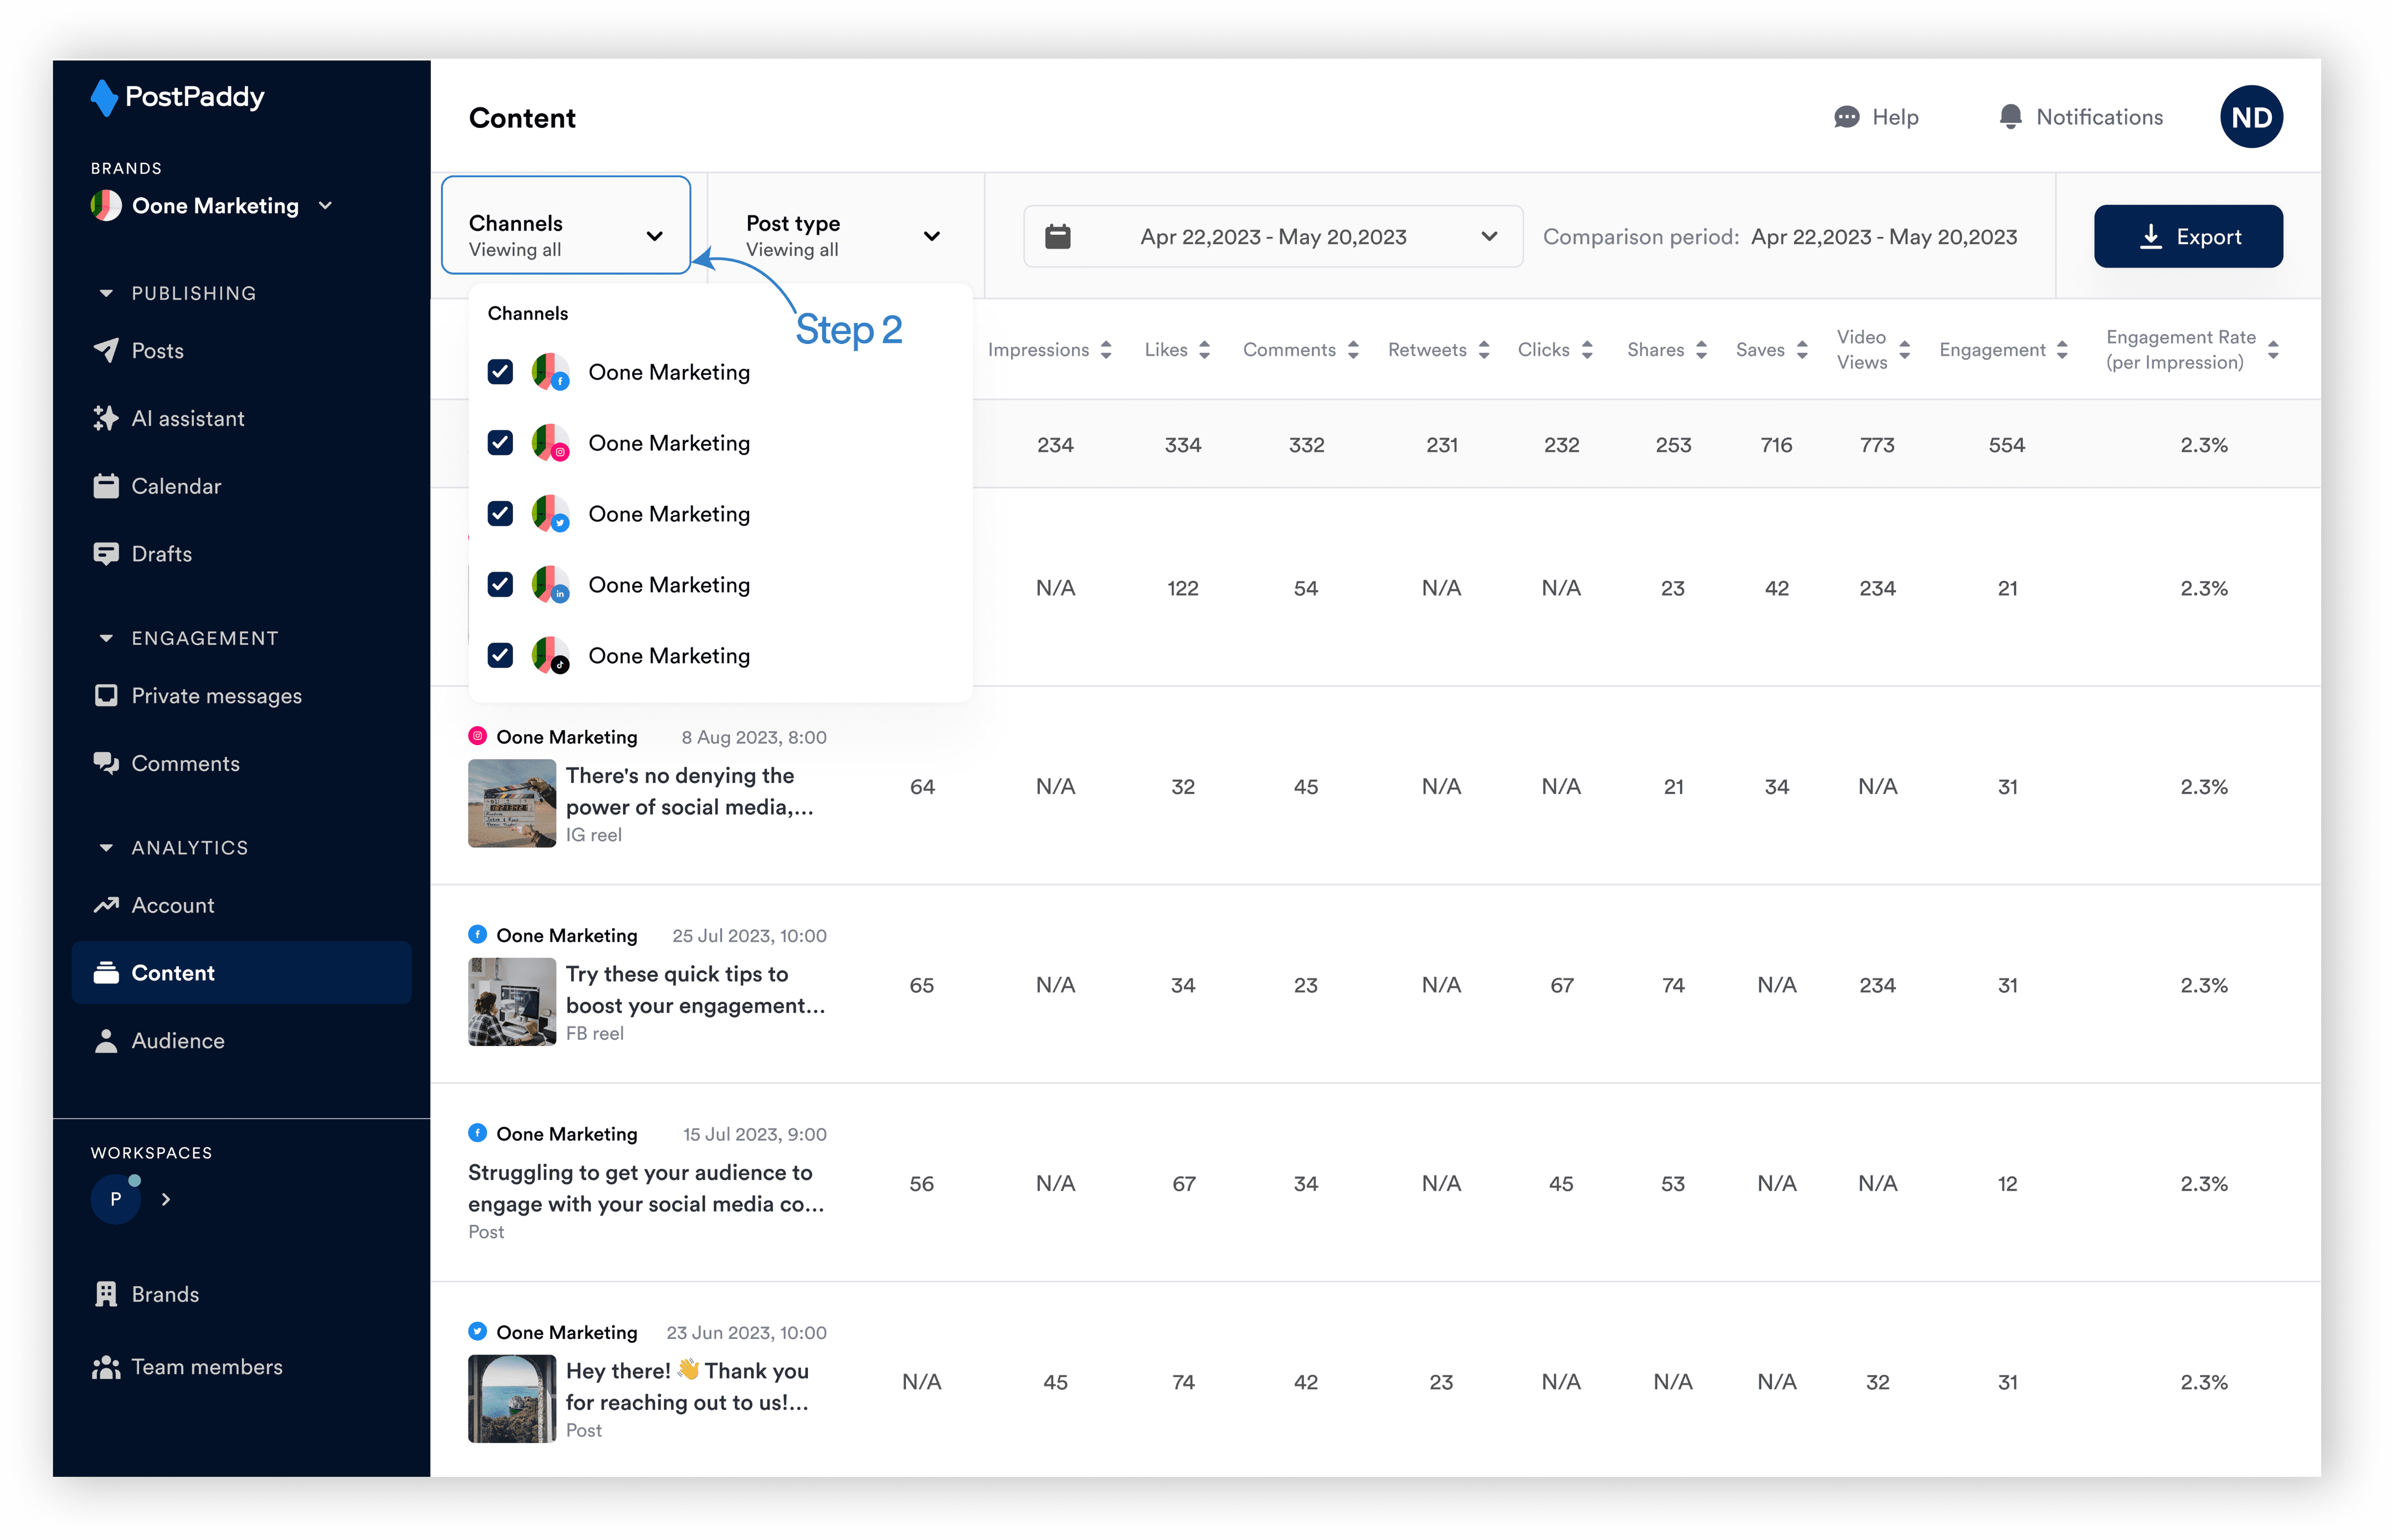
Step 3: Select the desired channel.
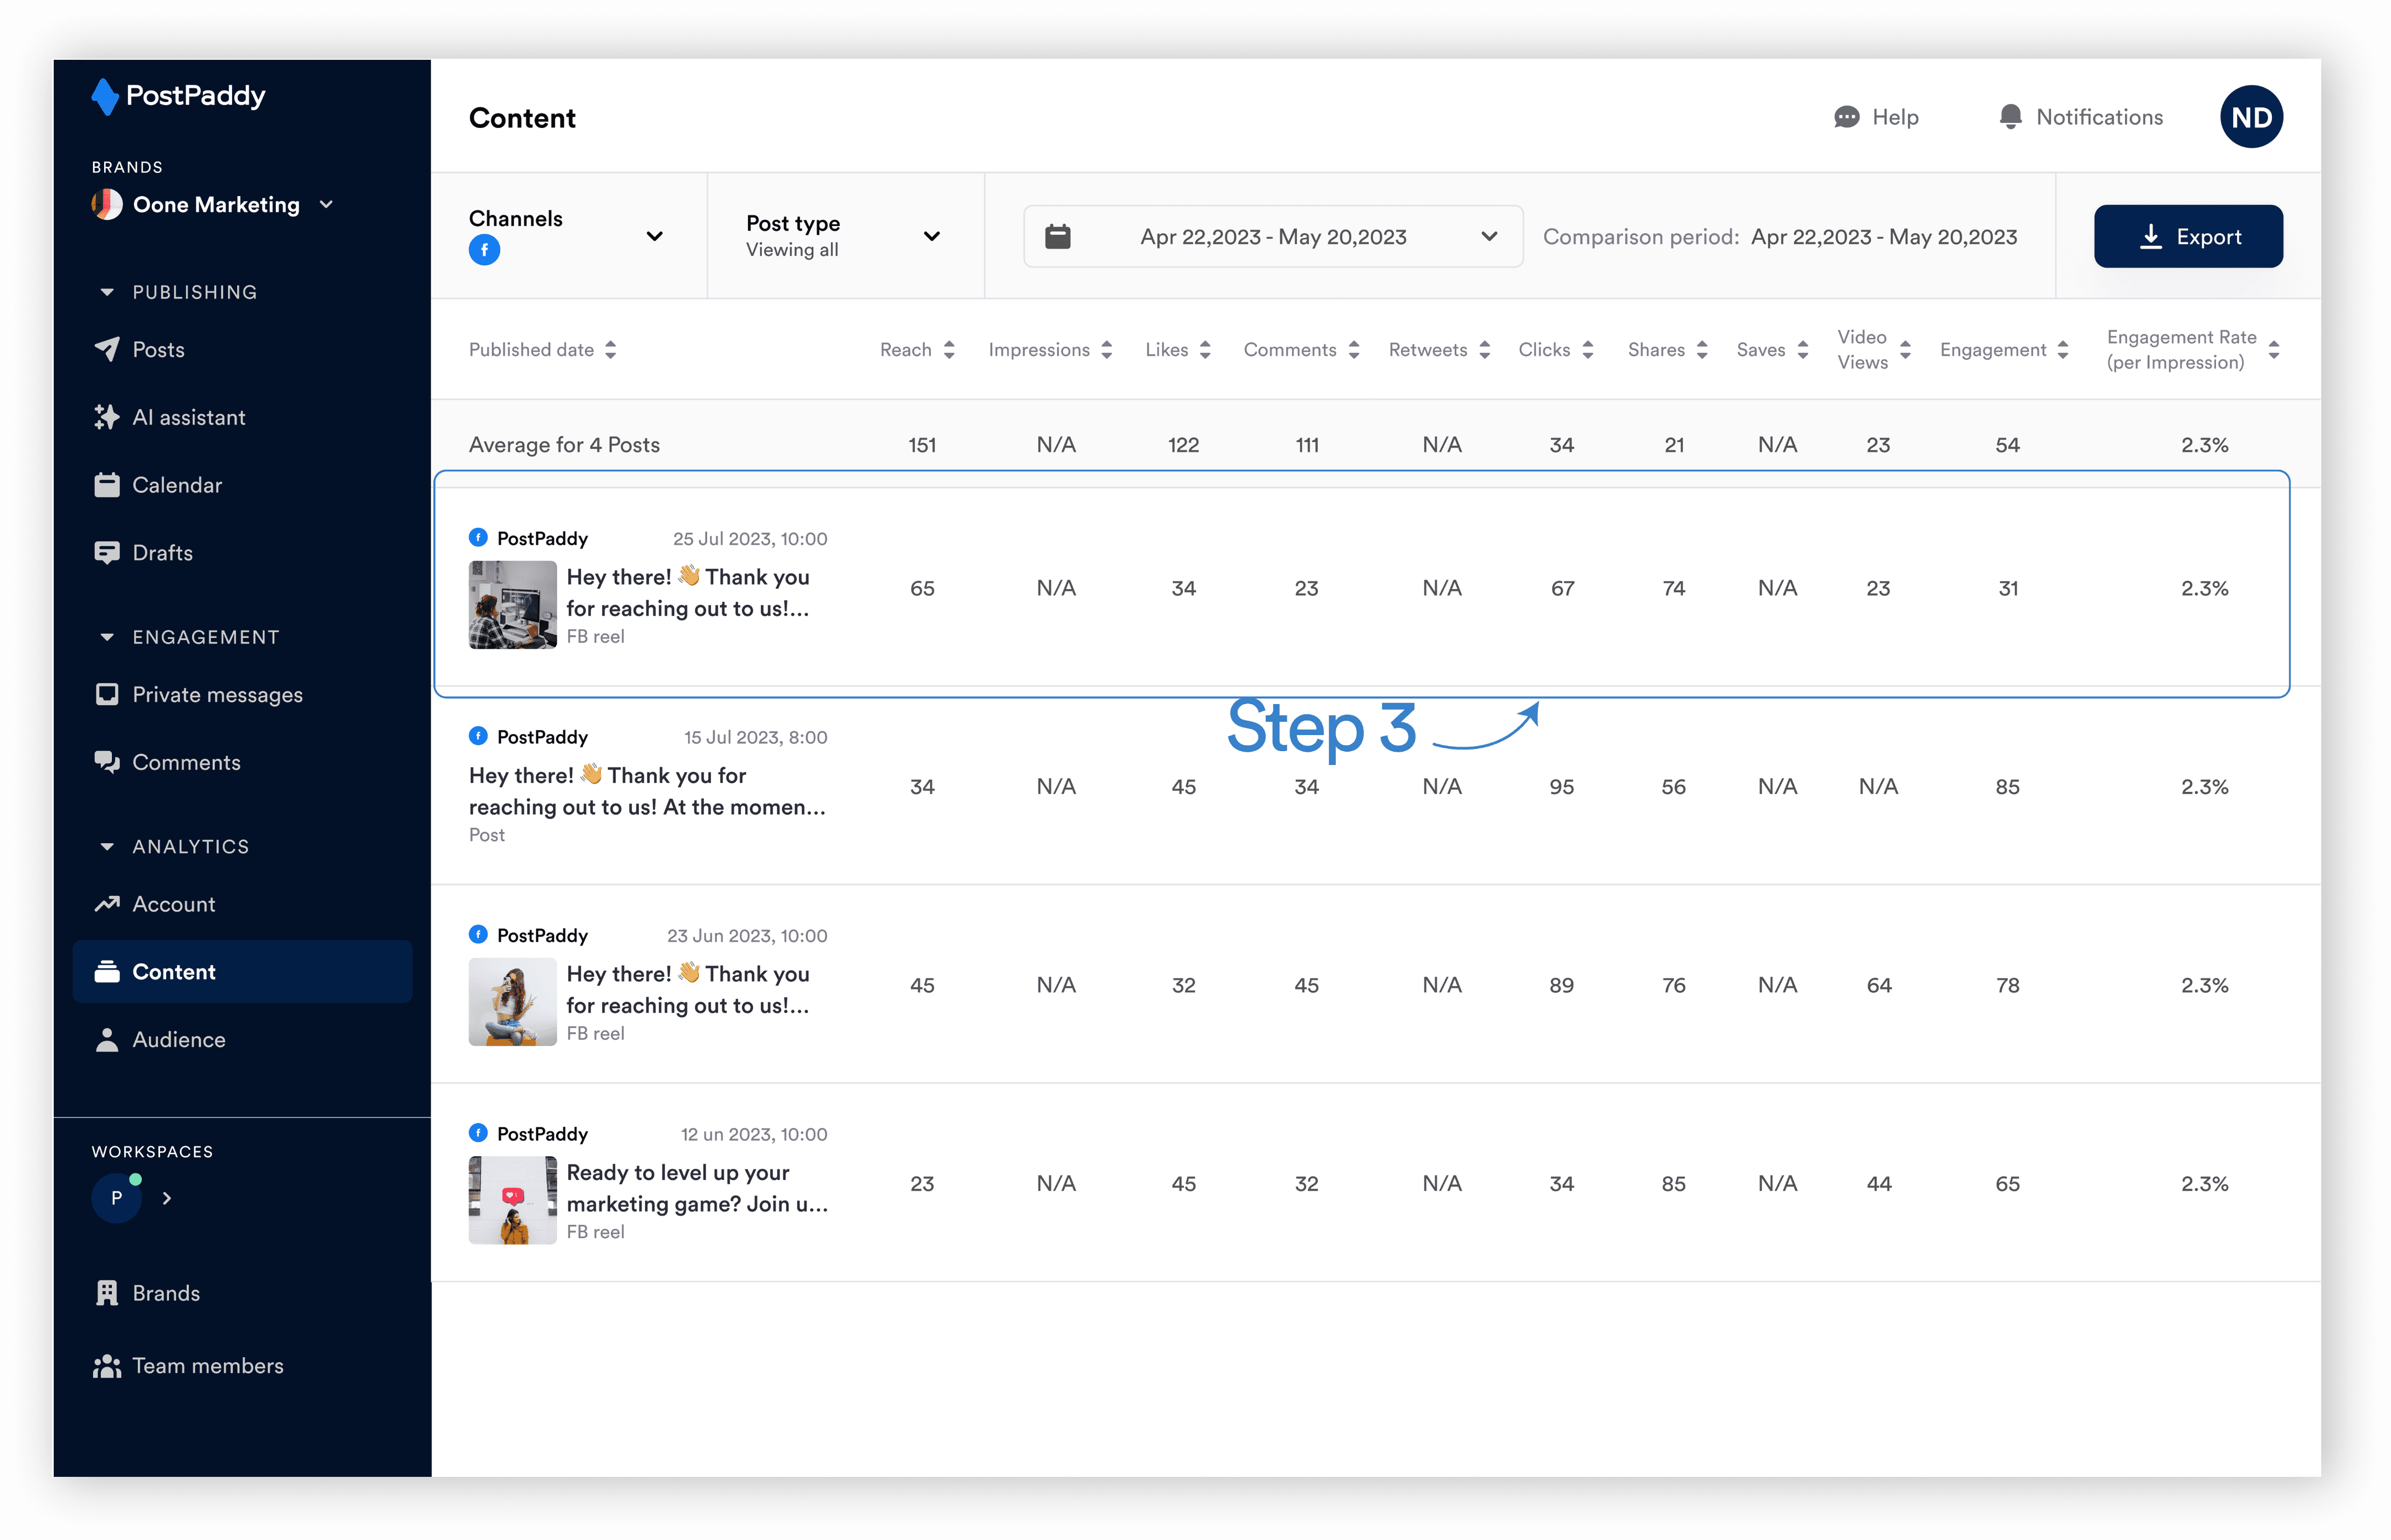
Your analytics data should be that of the selected channels.
How to use the date filter
Here’s how to filter your data by date:
Step 1: Select "Content" on the analytics area of the side navigation bar.
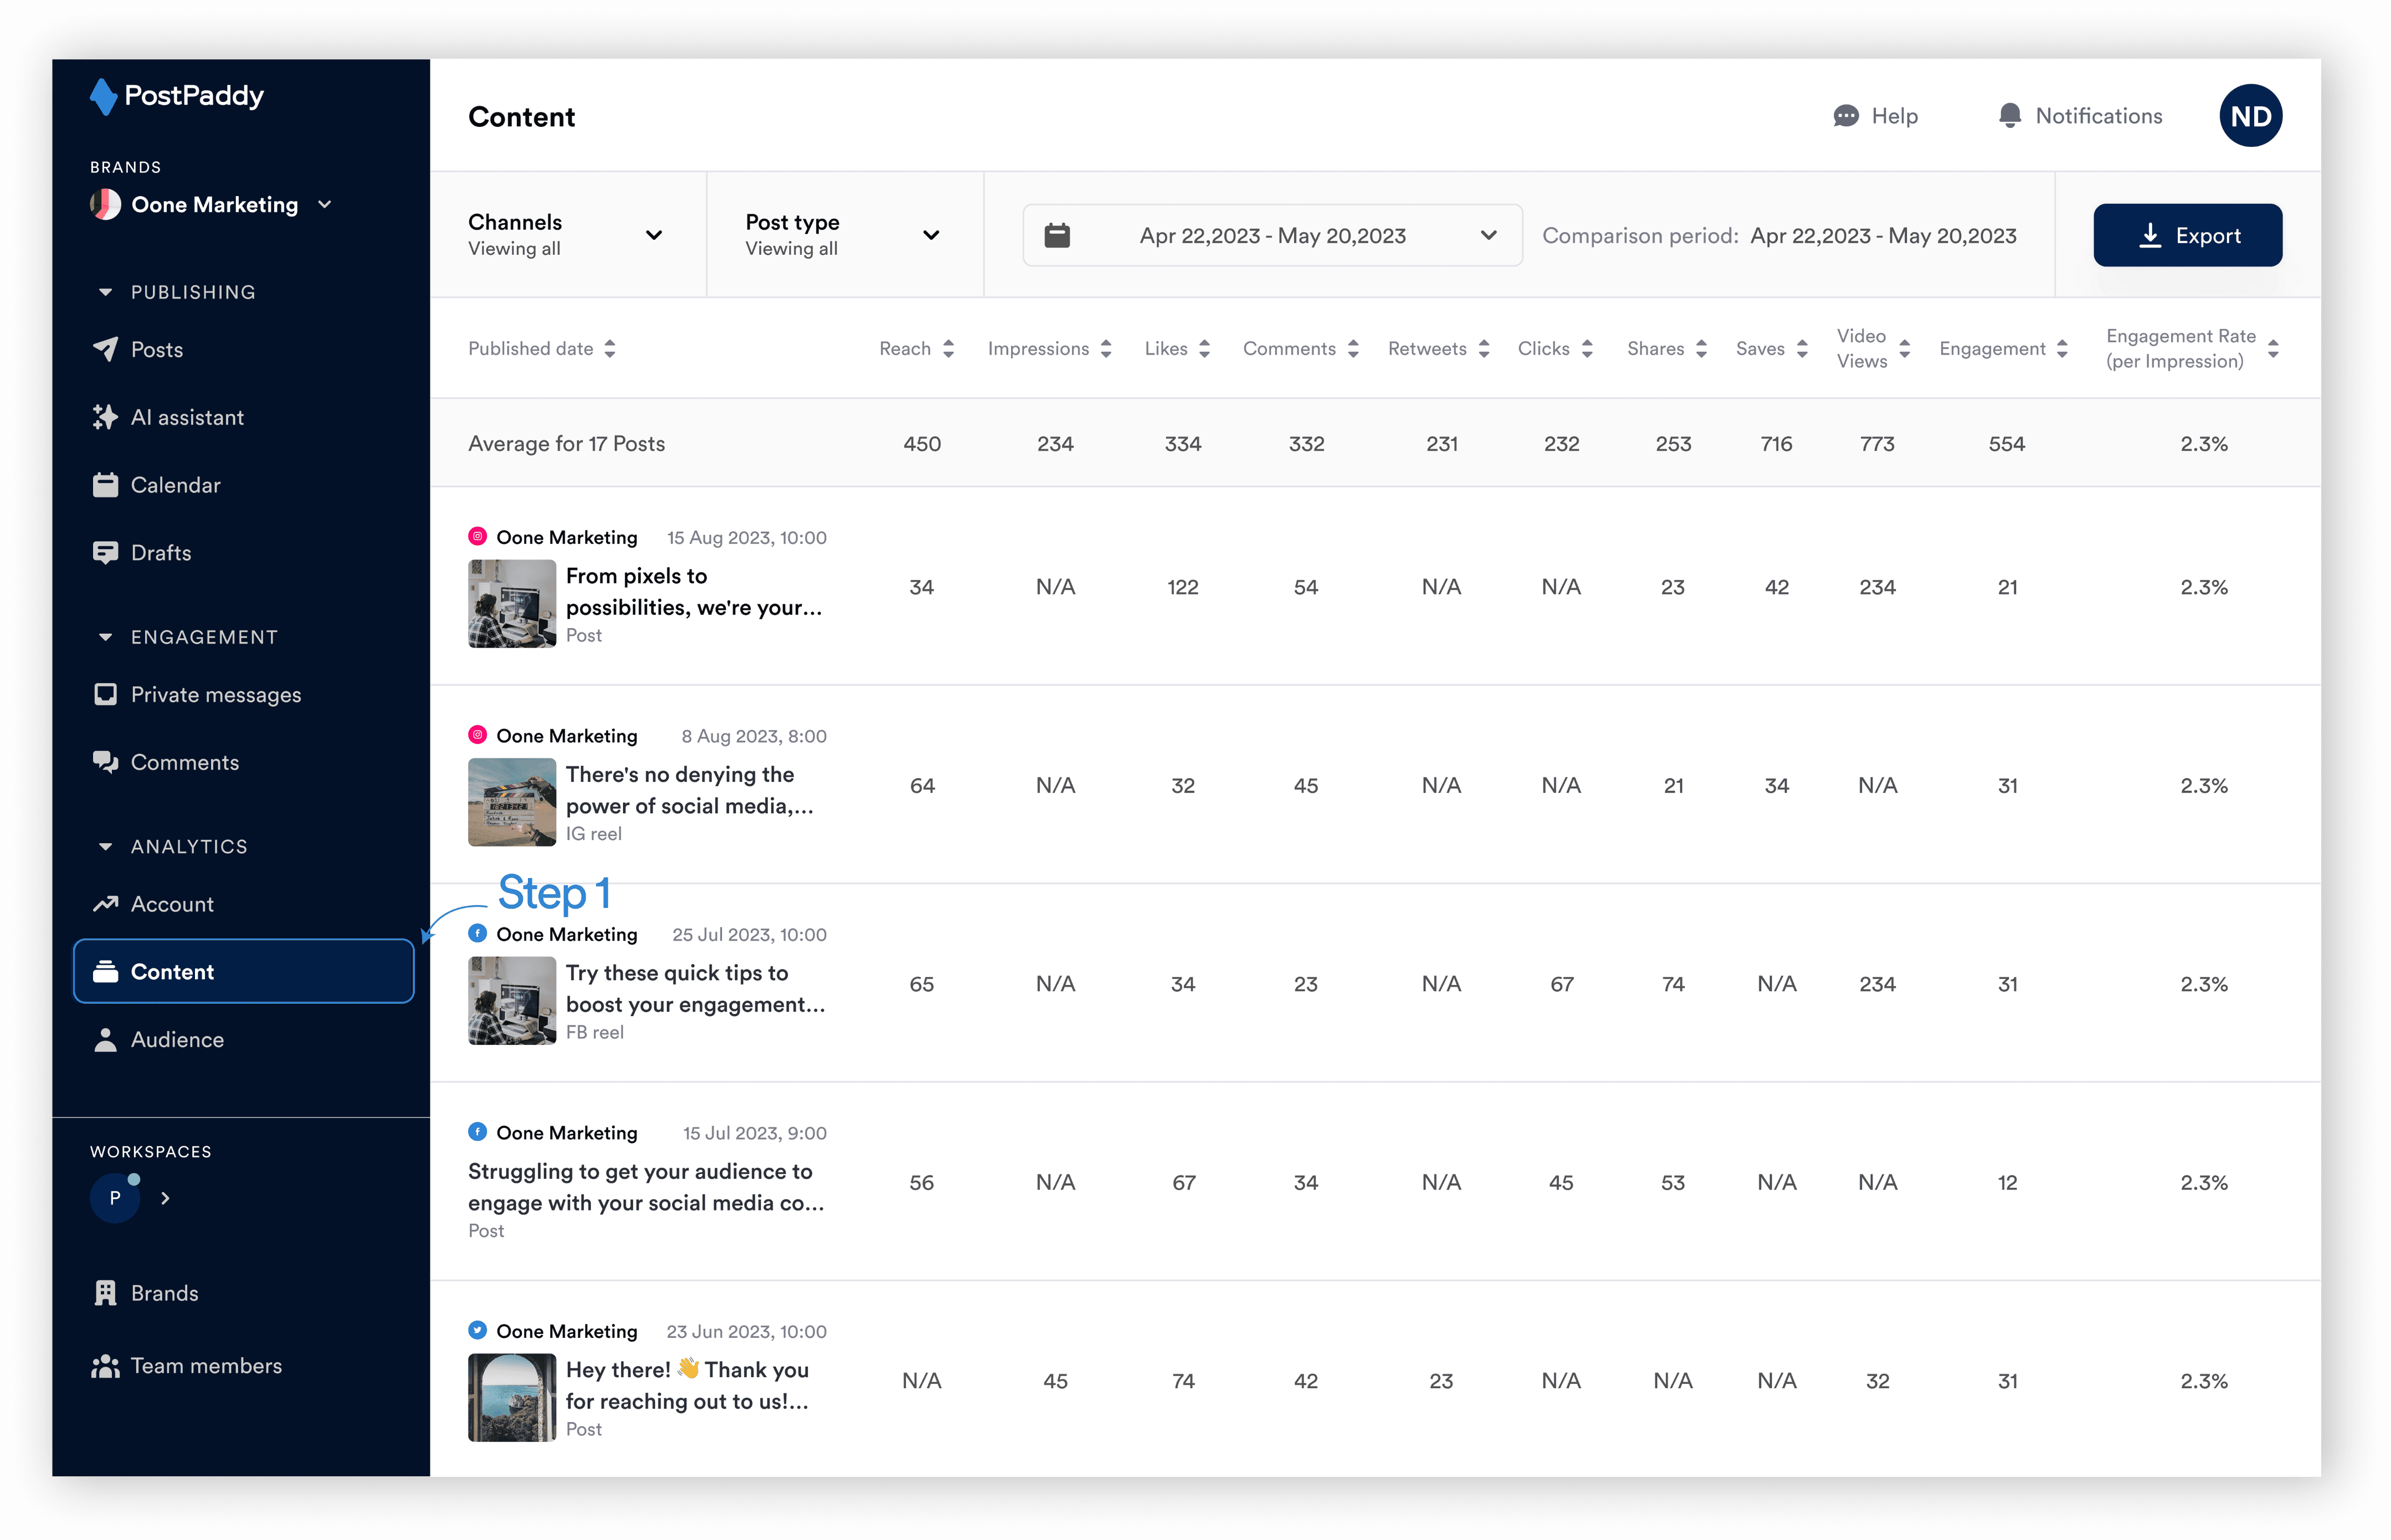
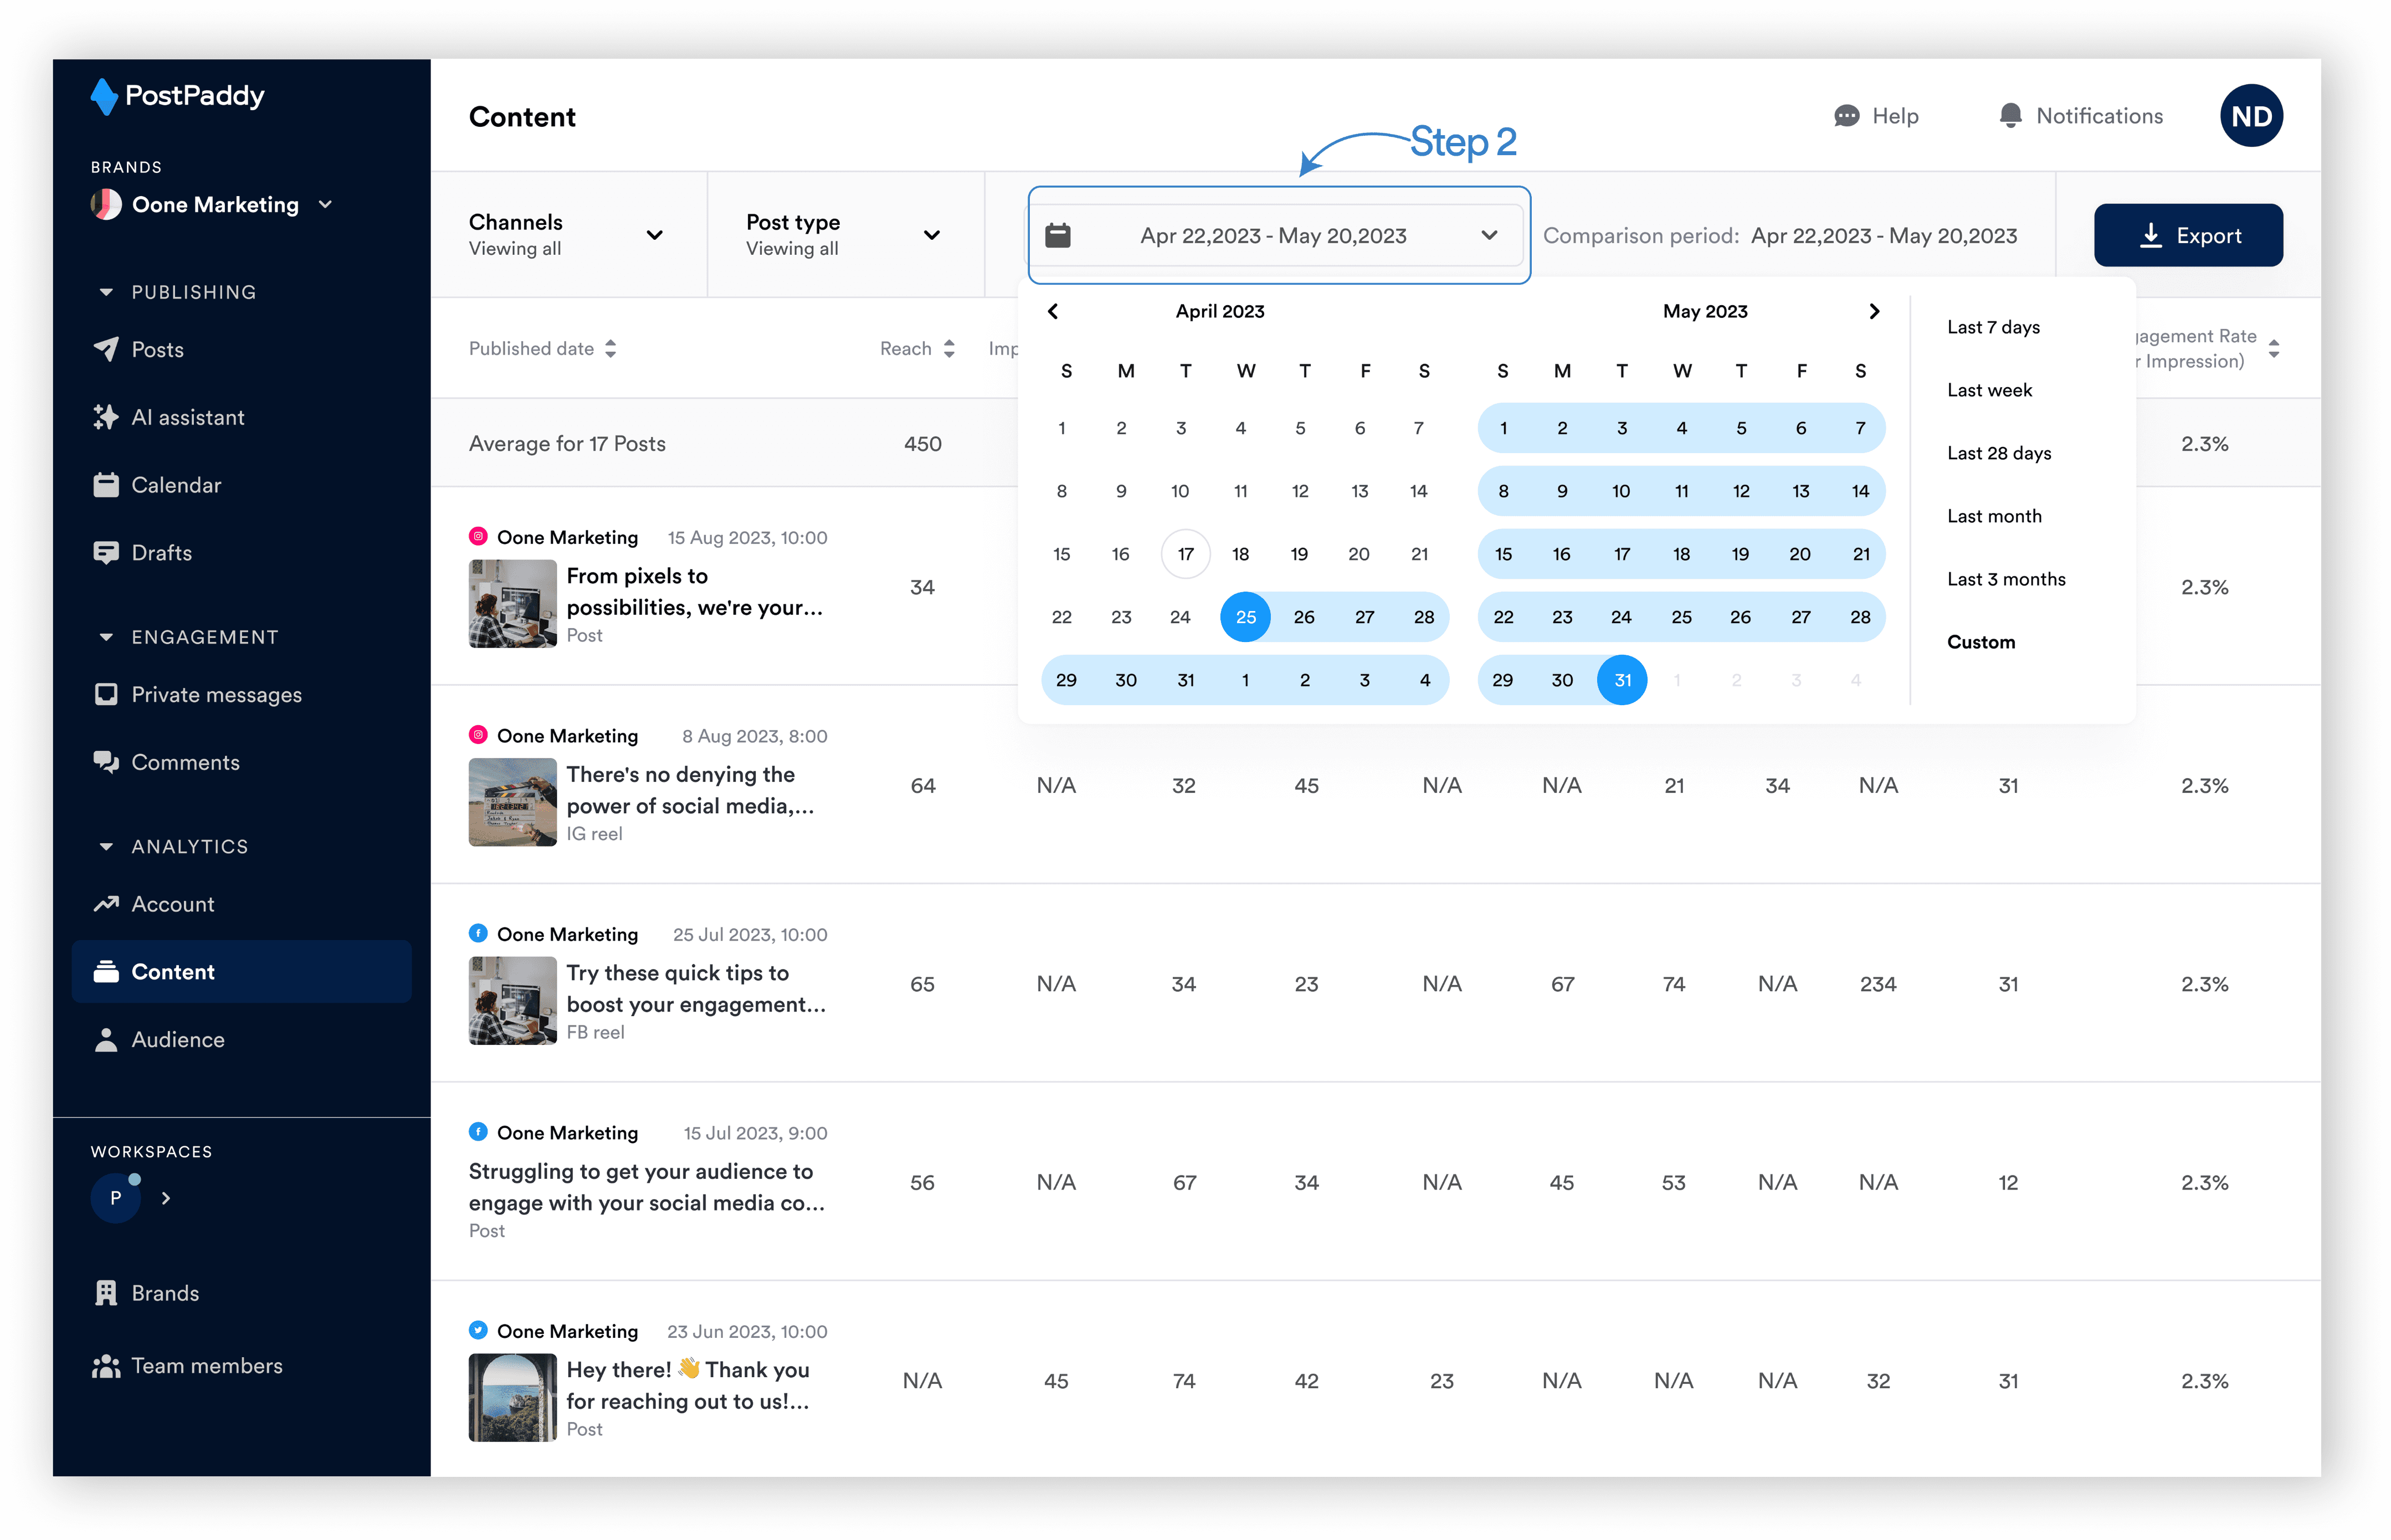
Step 2: Click the date filter.
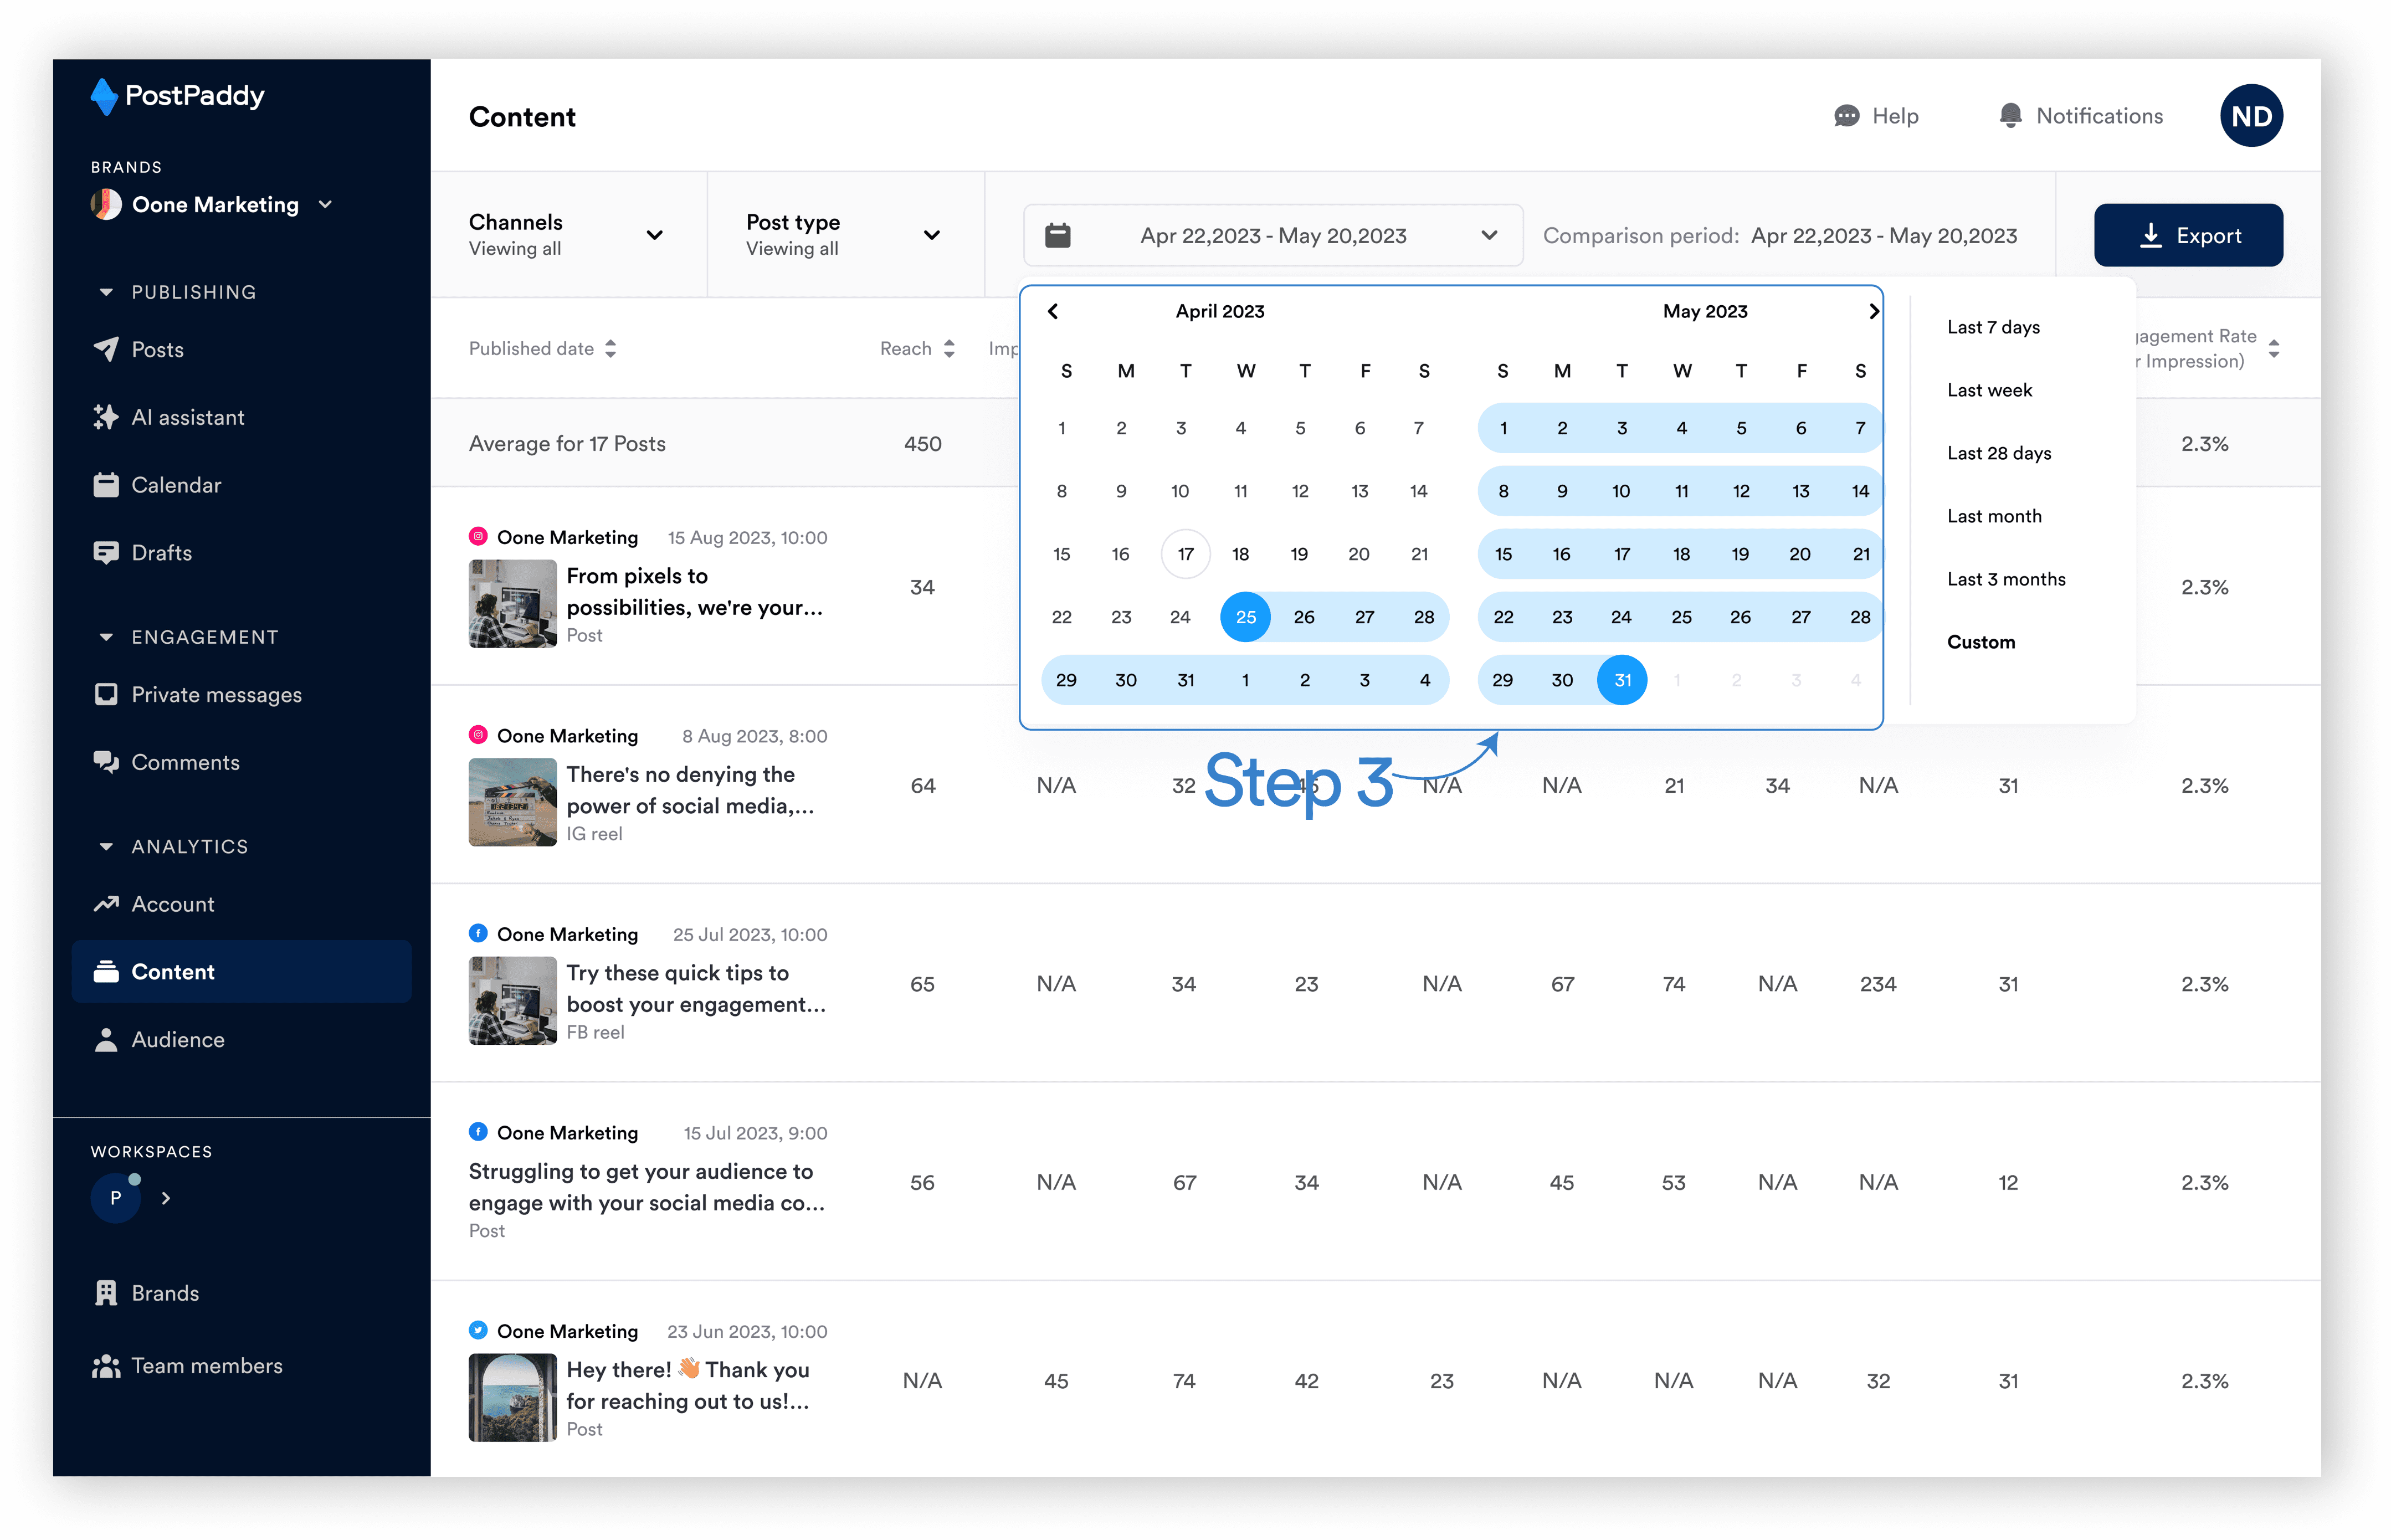
Step 3: Select the desired date.
Post type filter
You can filter the content analytics by post type. Here’s how:
Step 1: Select "Content" on the analytics area of the side navigation bar.
Step 2: Select “Post type filter.”
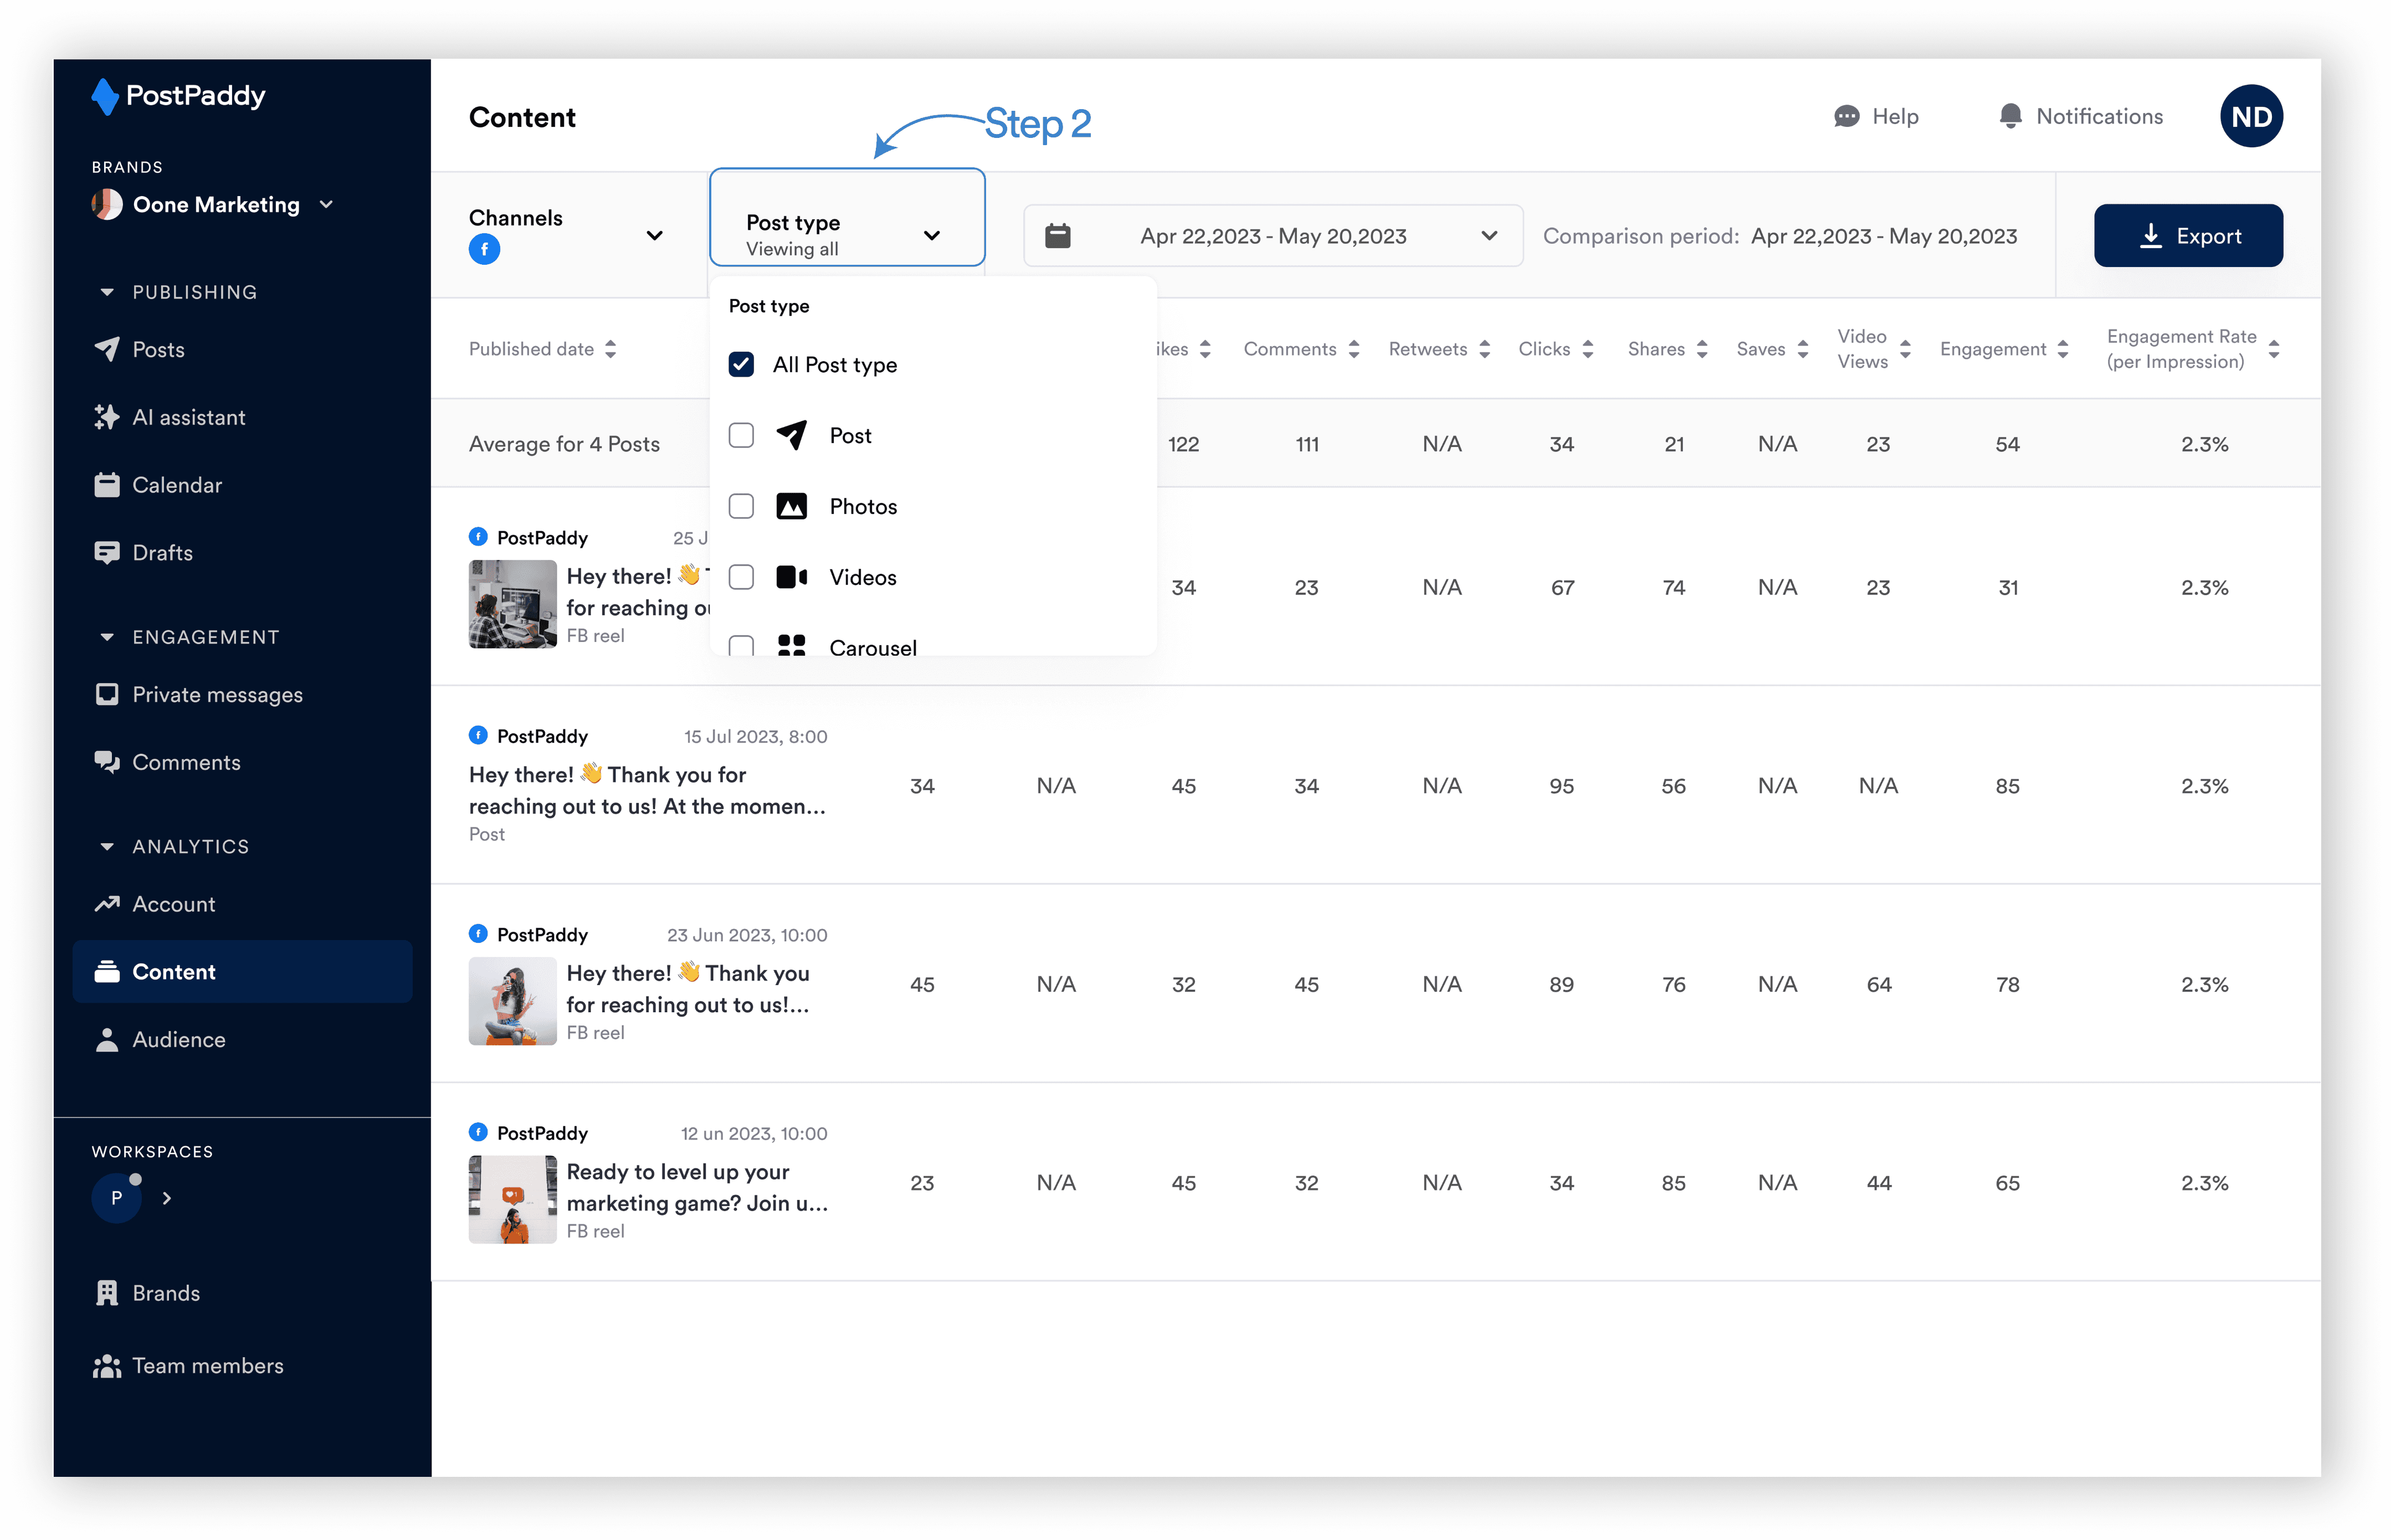
Step 3: Select the desired post type.
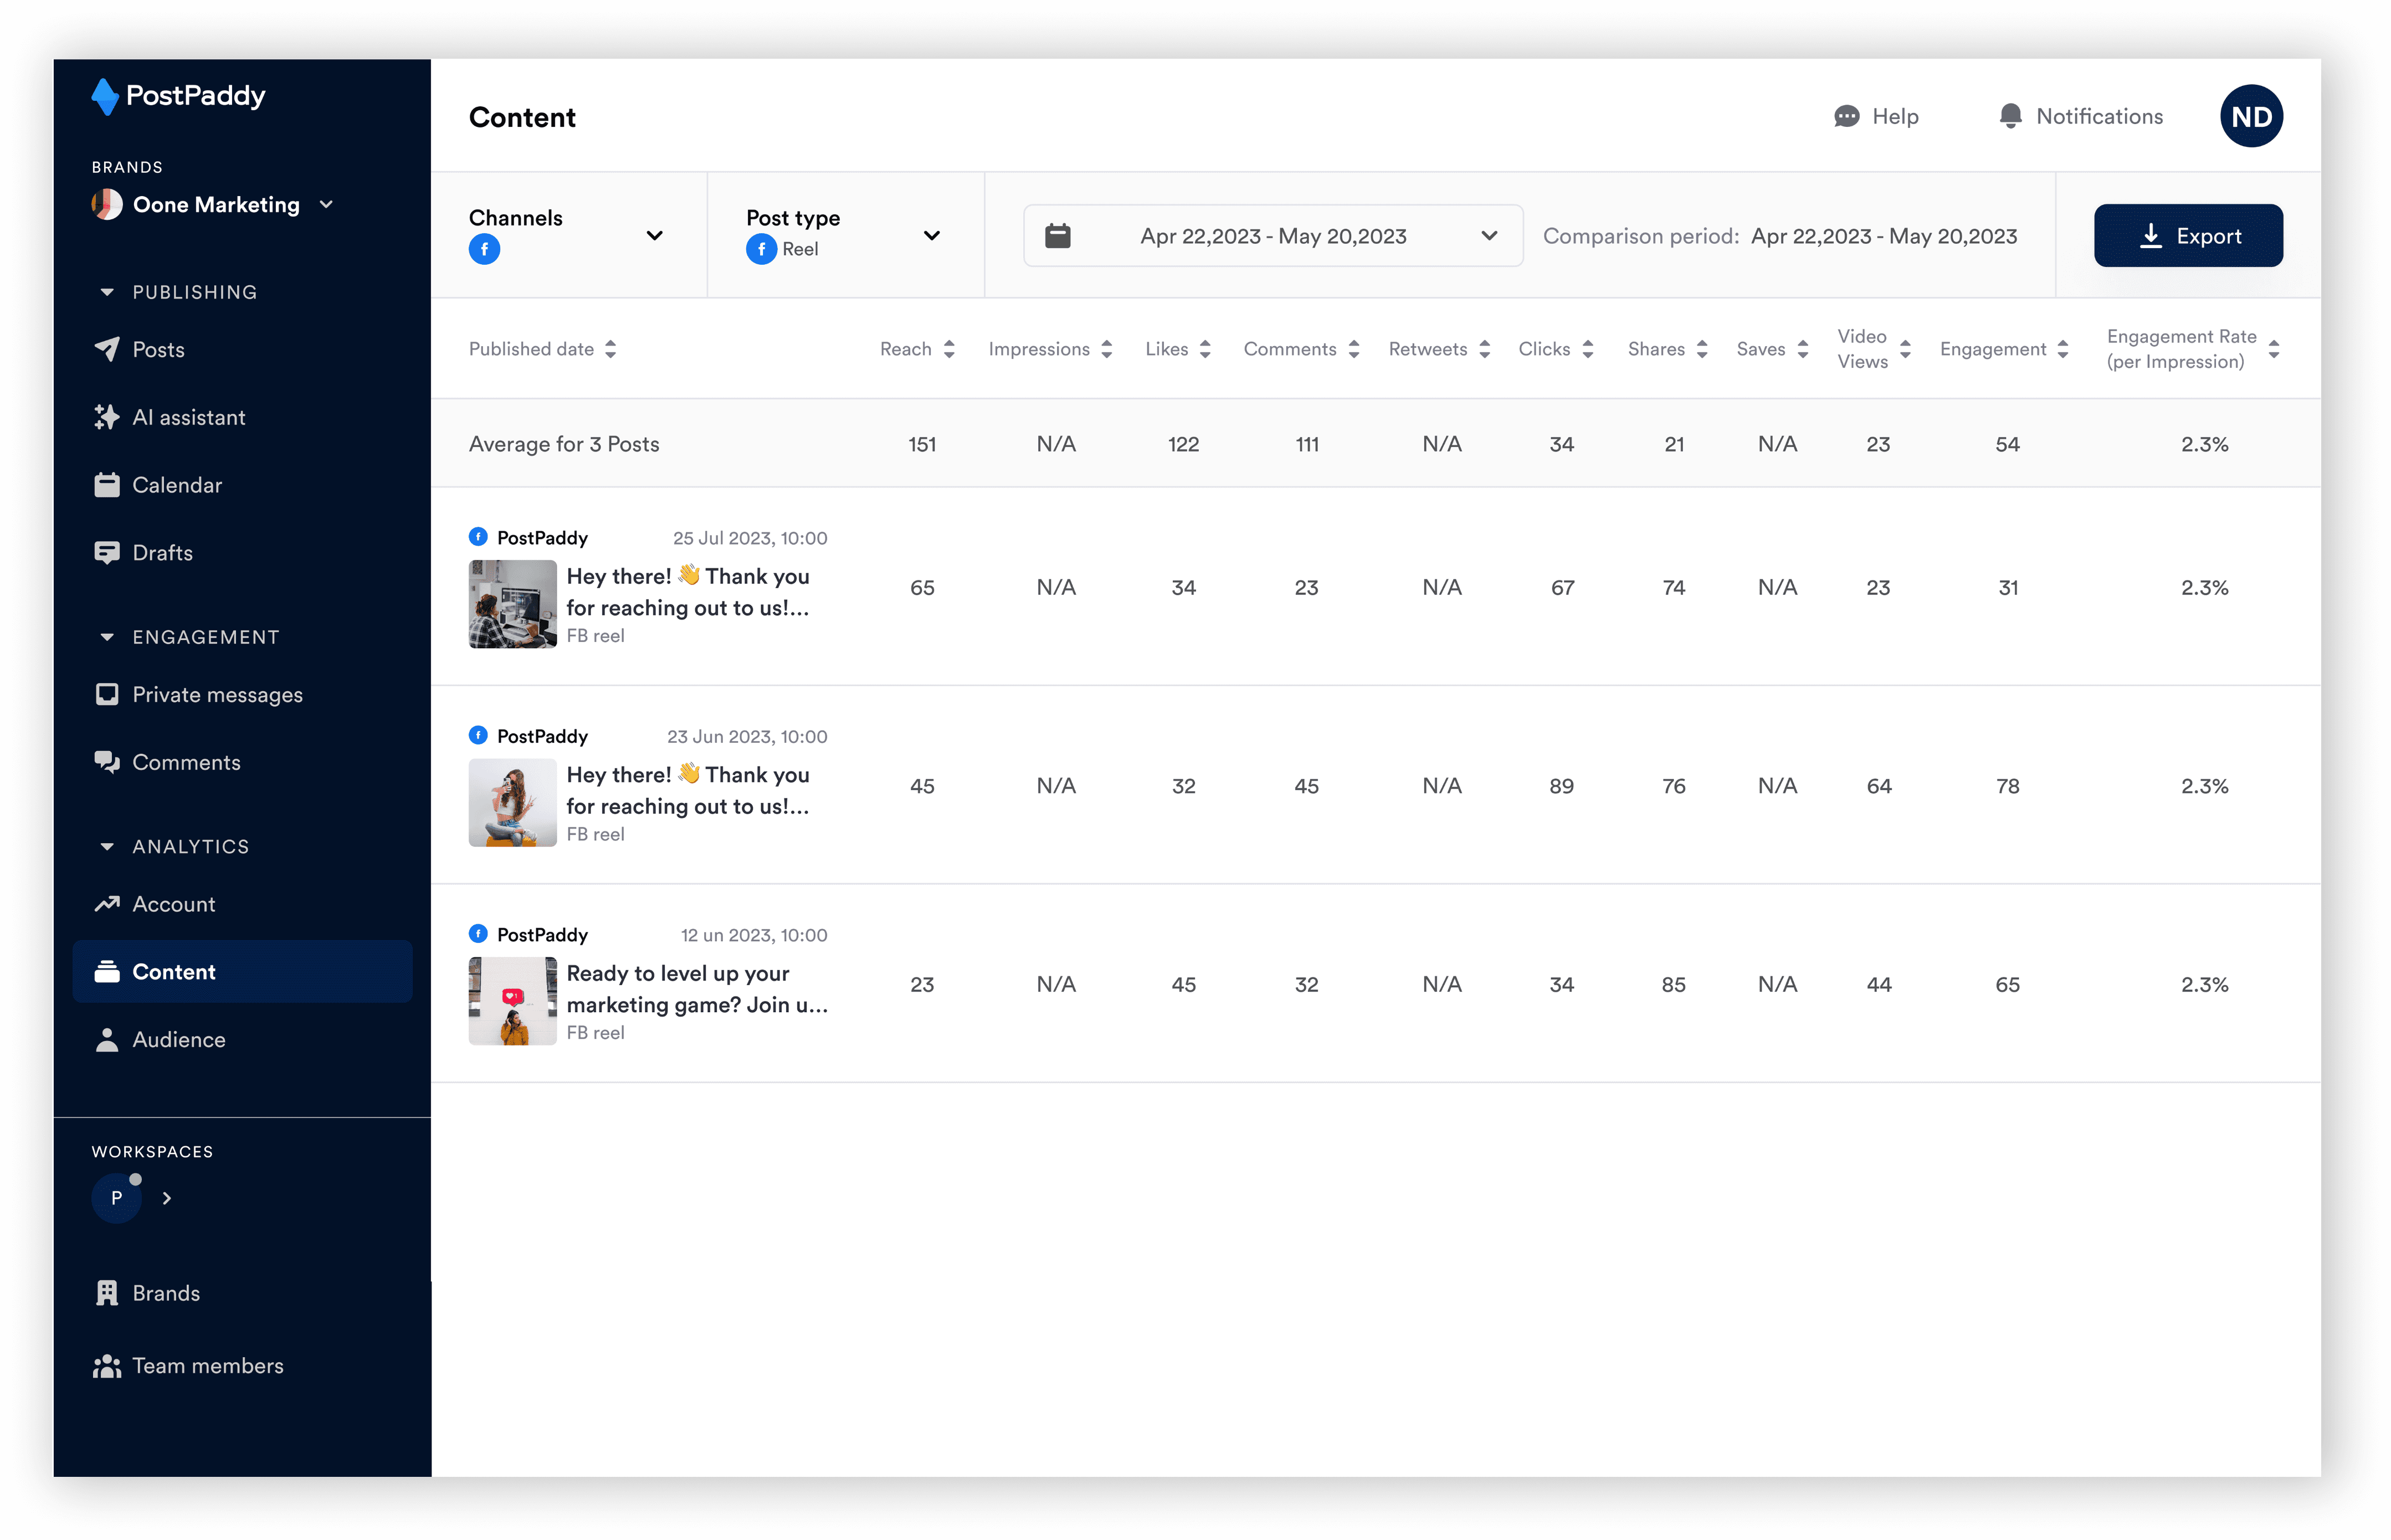
Viewing post data and average
You can see all the post data and the average of all the analytics data for all posts. Here’s how:
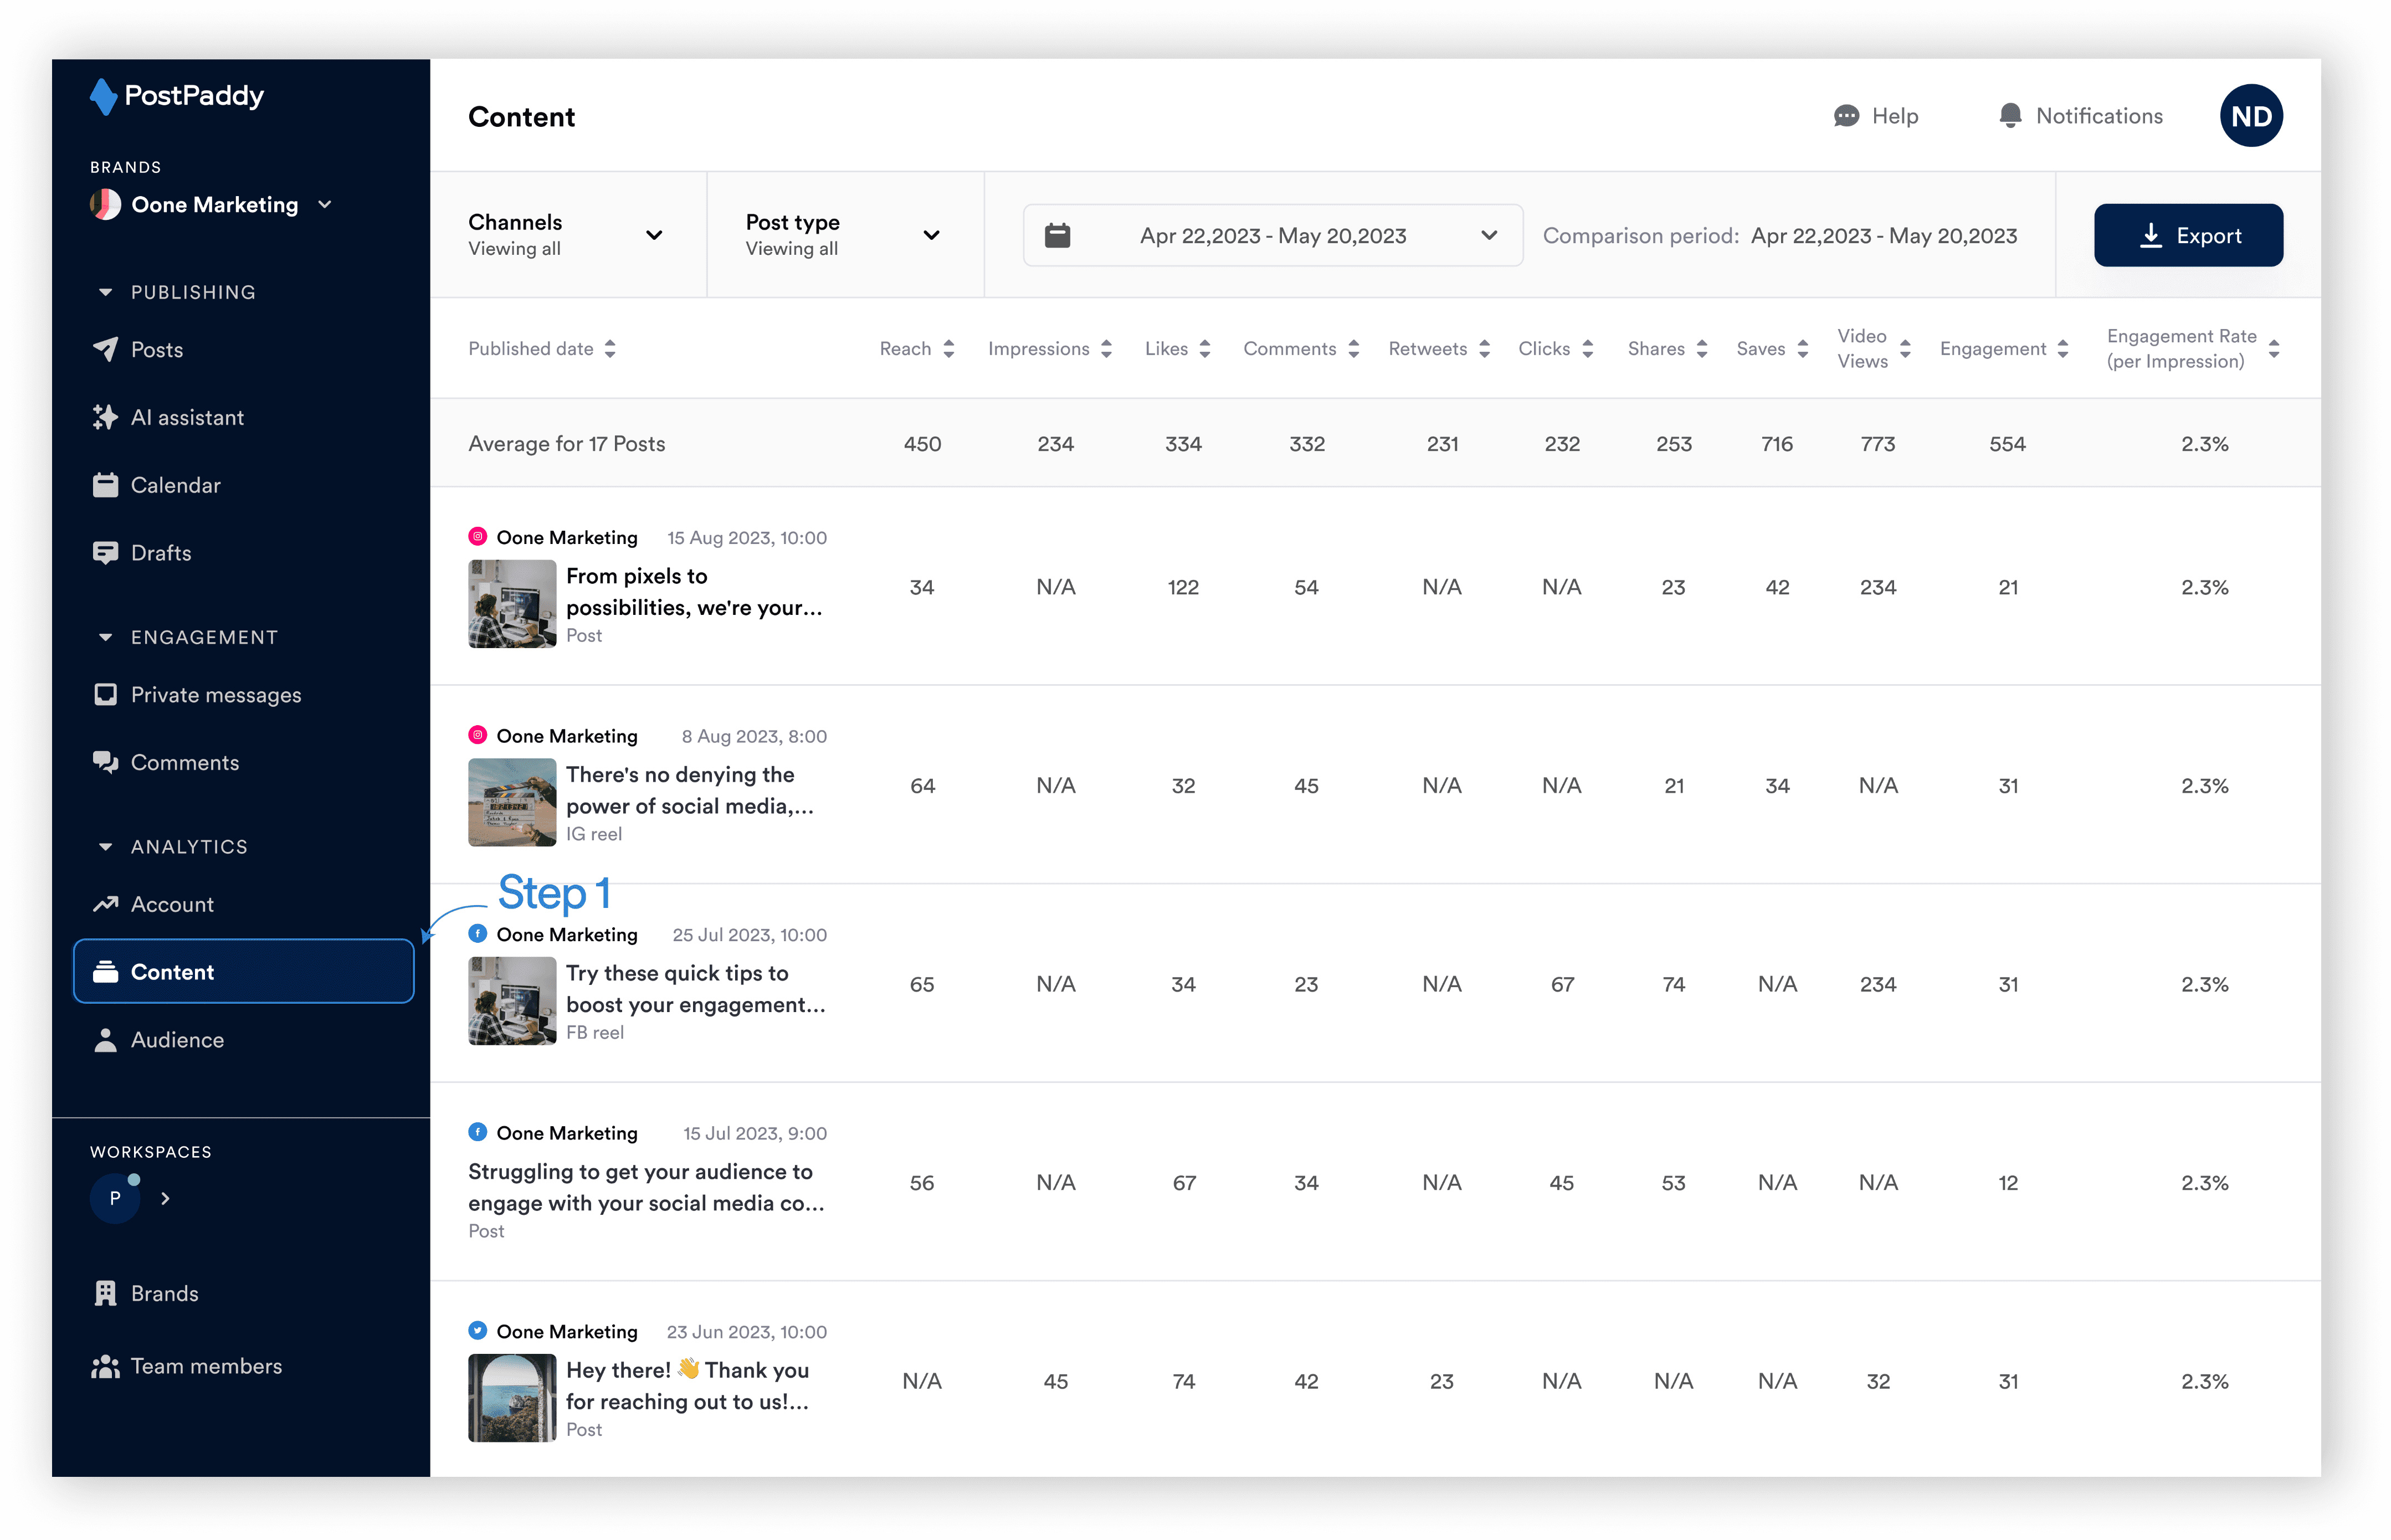
Step 1: Select "Content" on the analytics area of the side navigation bar.
Step 2: View the top menu on the table.
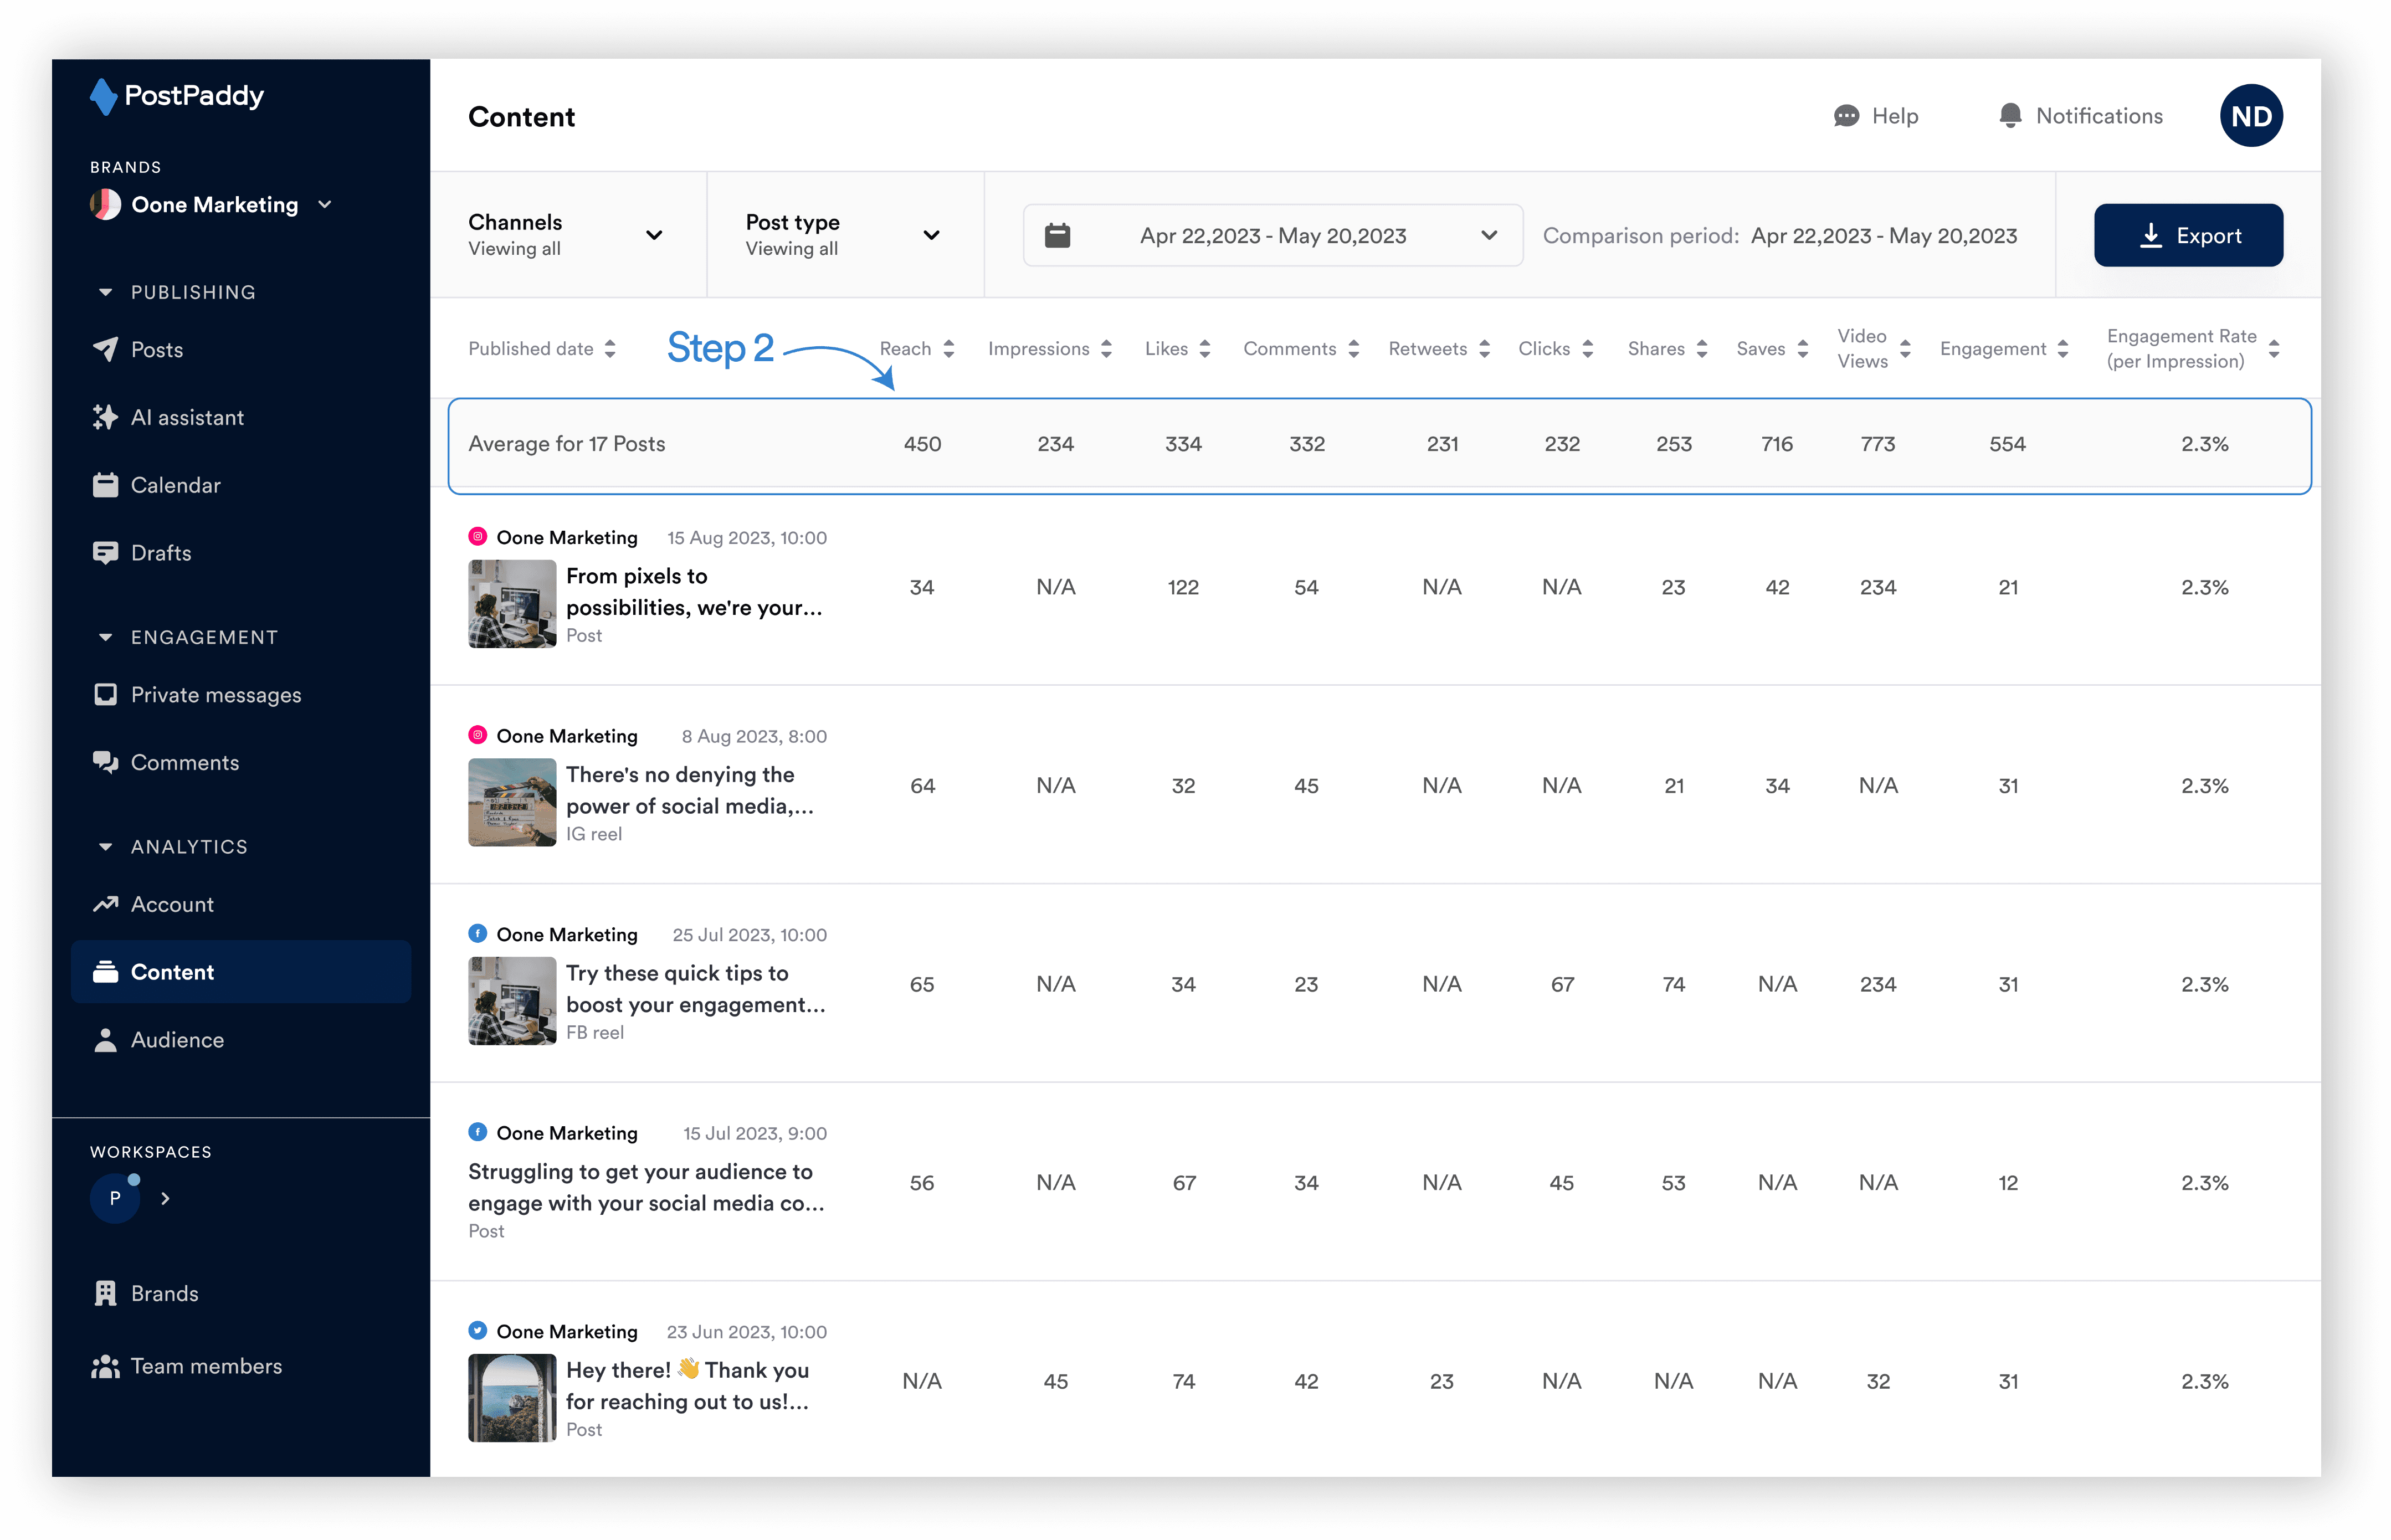
You will see the average for each metric for the selected channel(s).
How to export data
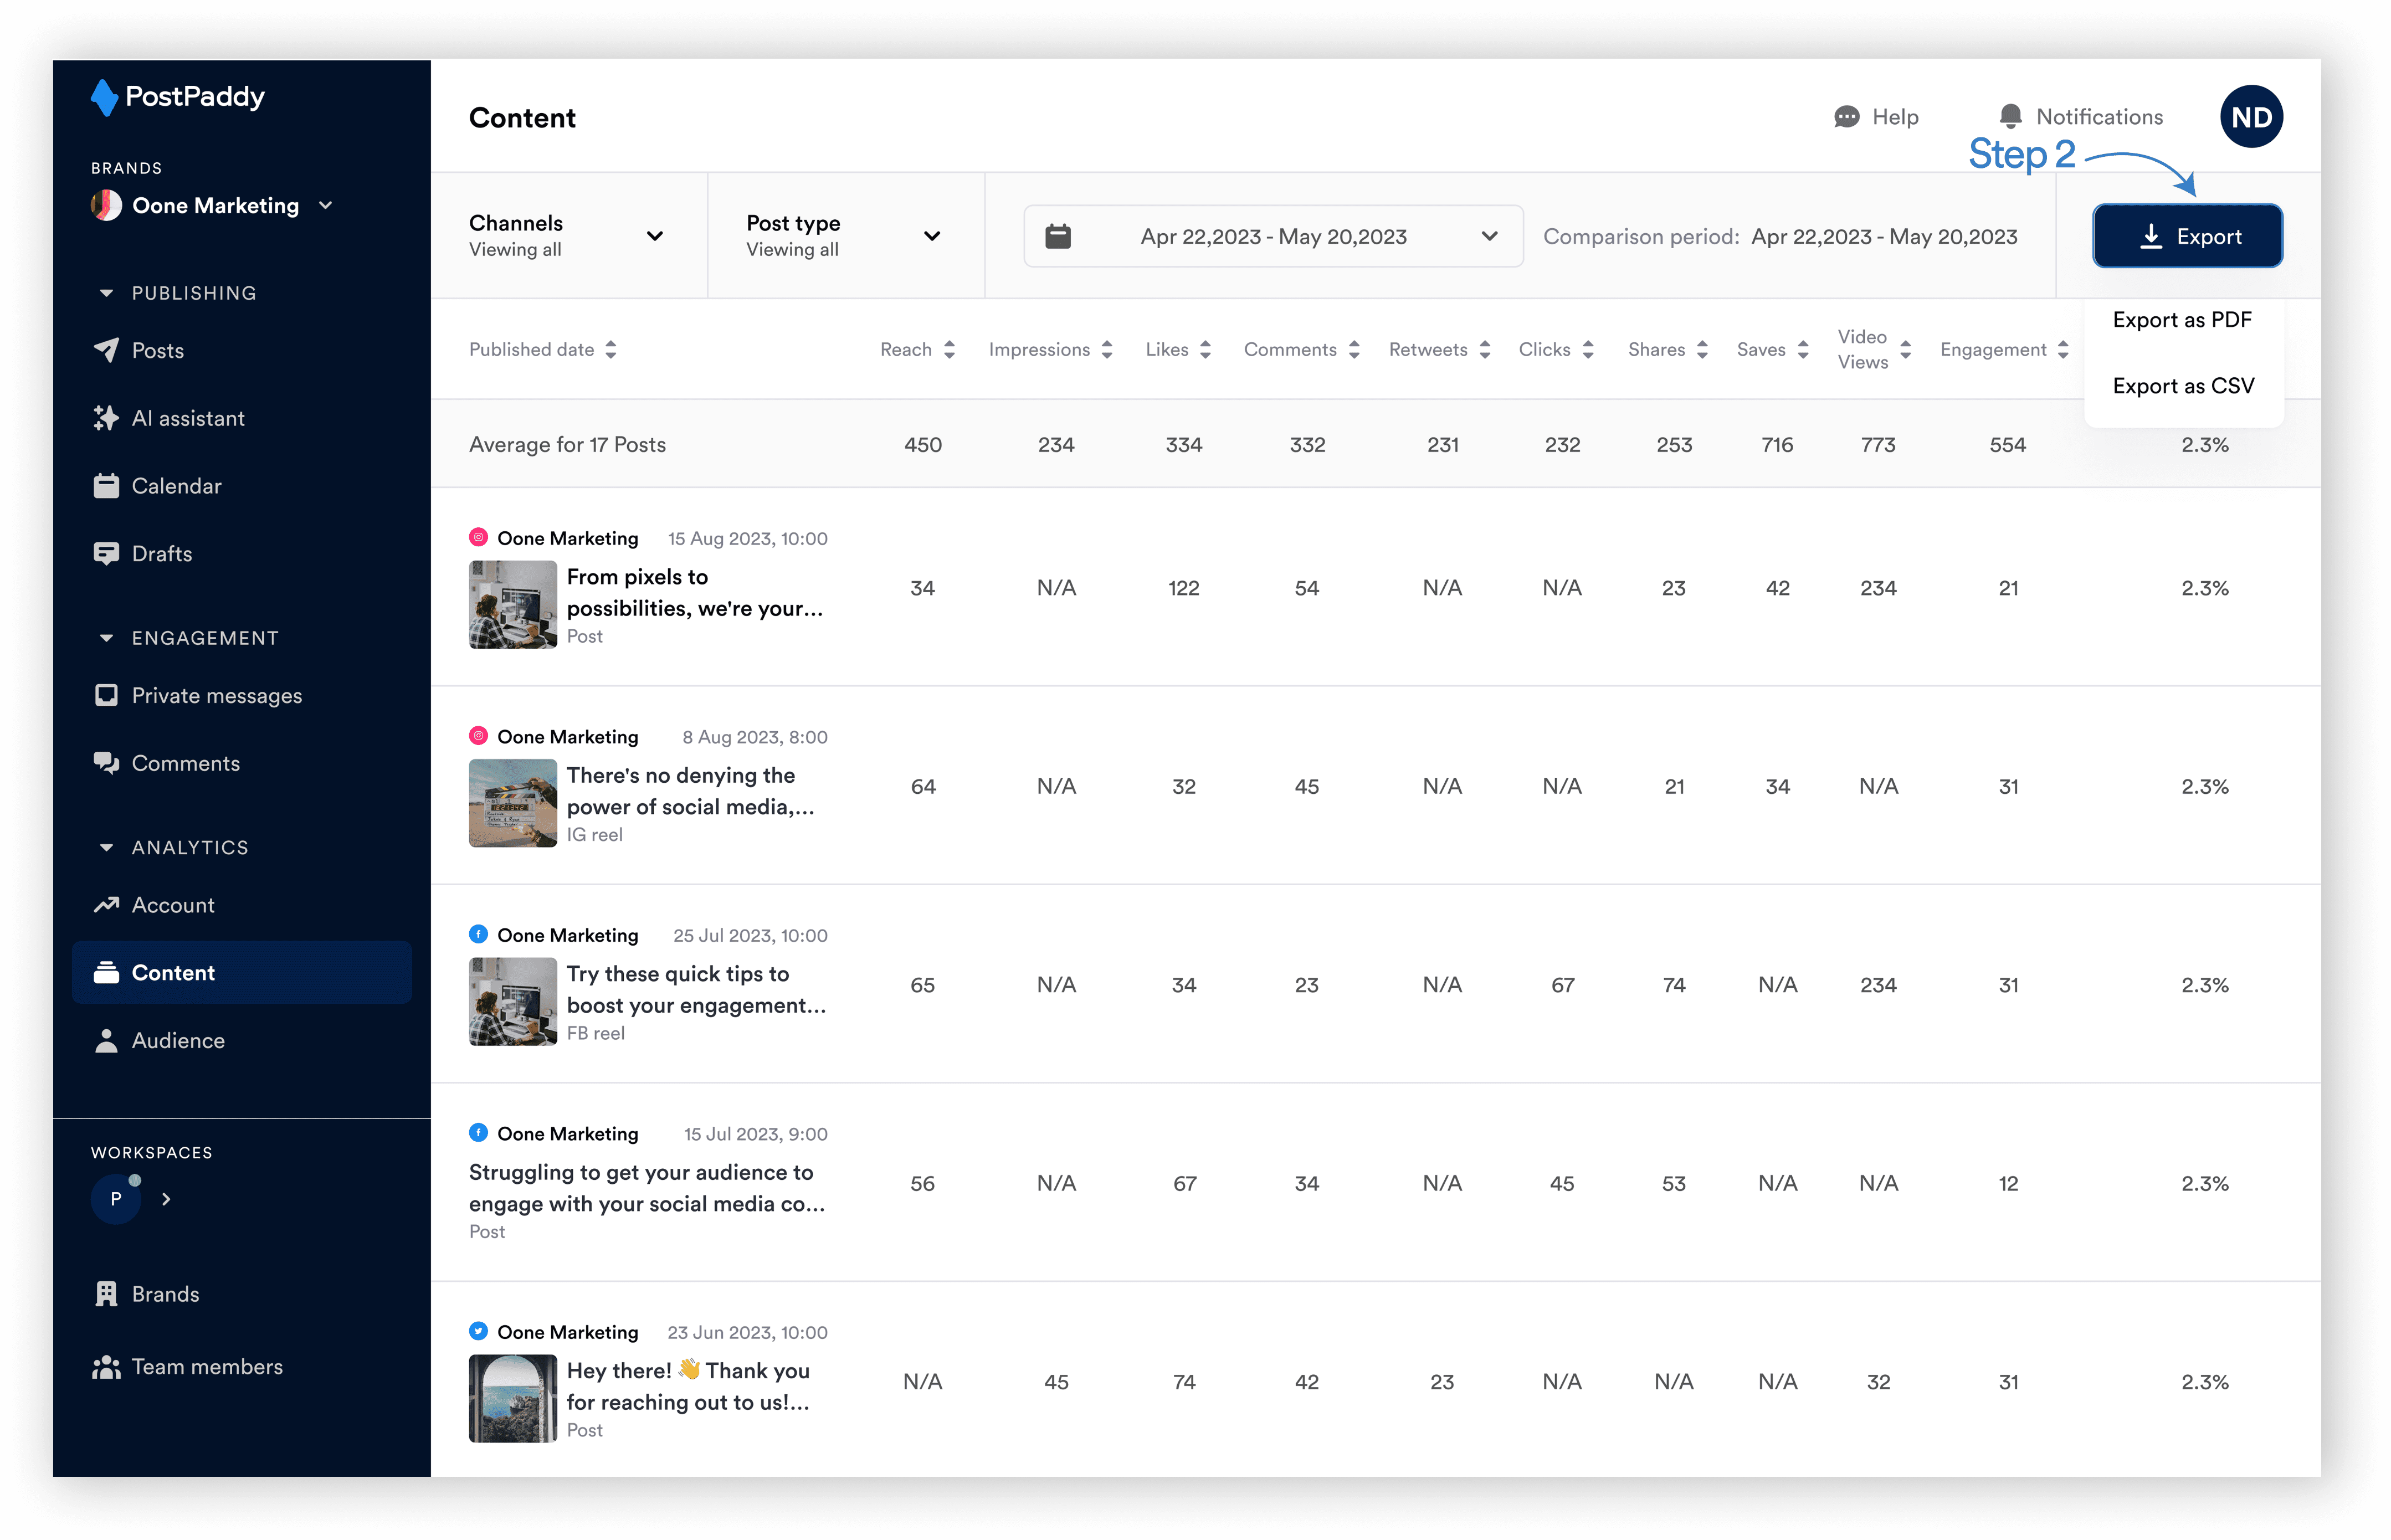
Here’s how to export your content analytics data from PostPaddy:
Step 1: Select "Content" on the analytics area of the side navigation bar.
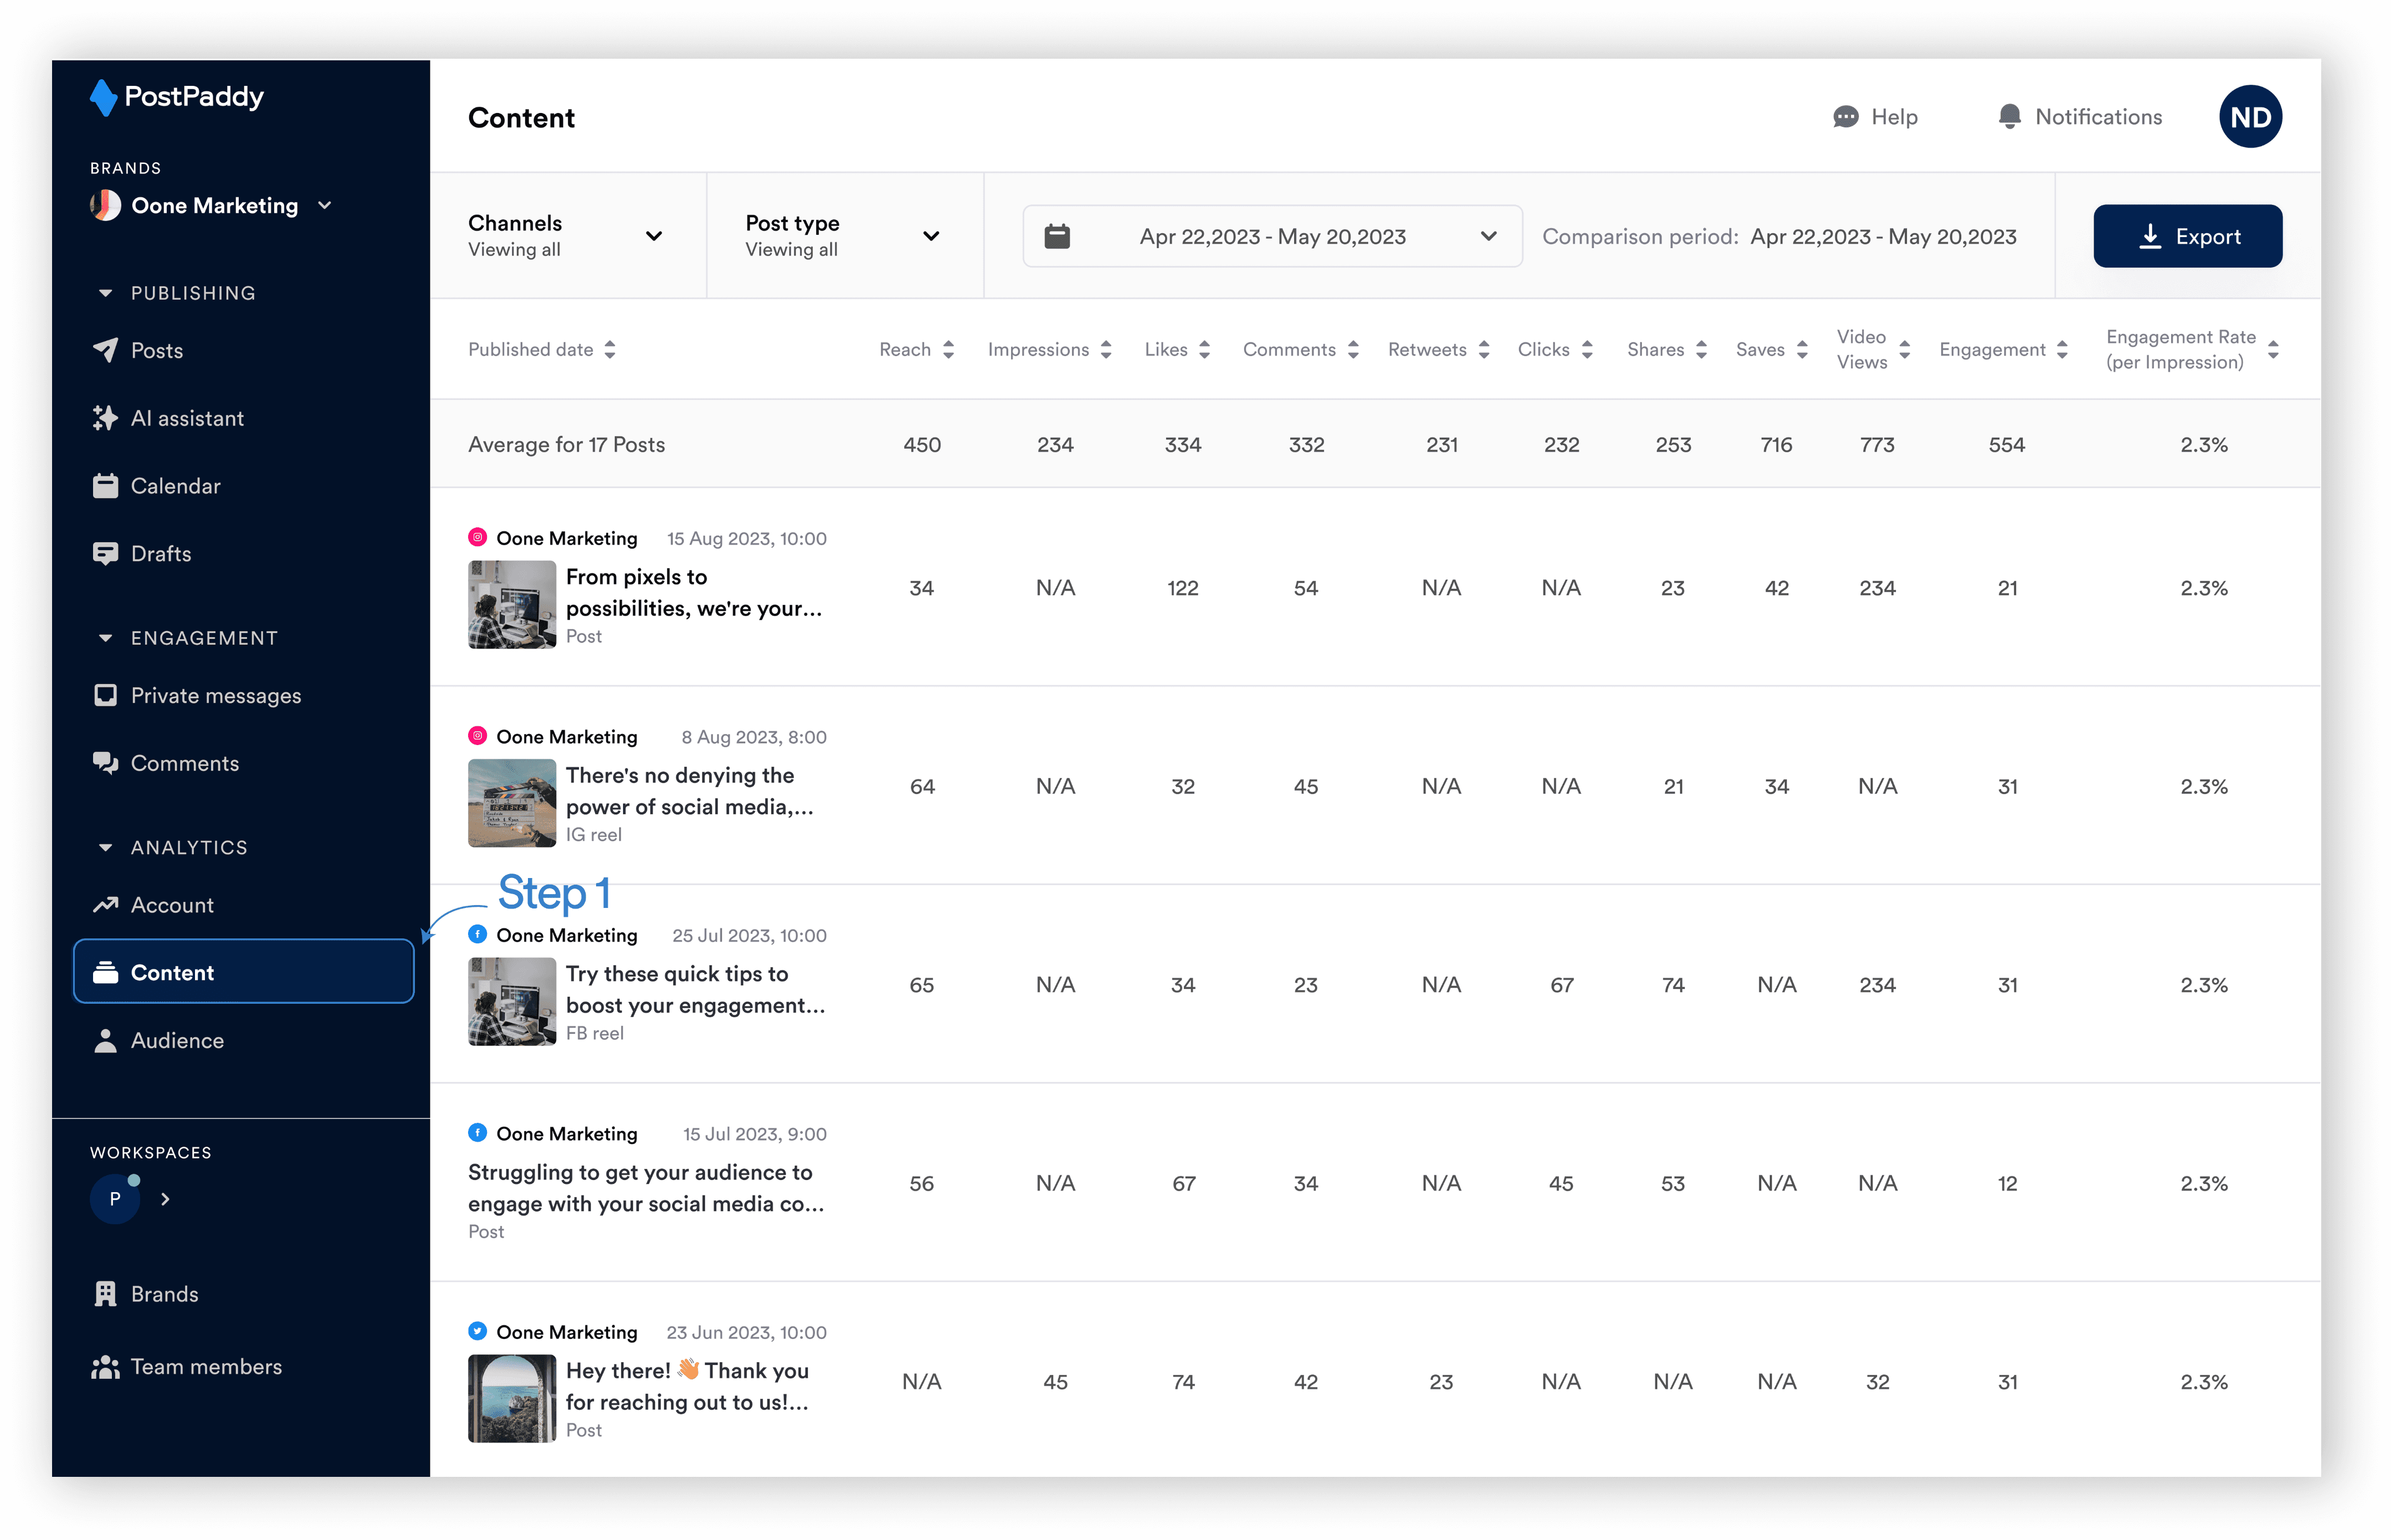
Step 2: Hit the export button.
Step 3: Select the export file type (PDF).
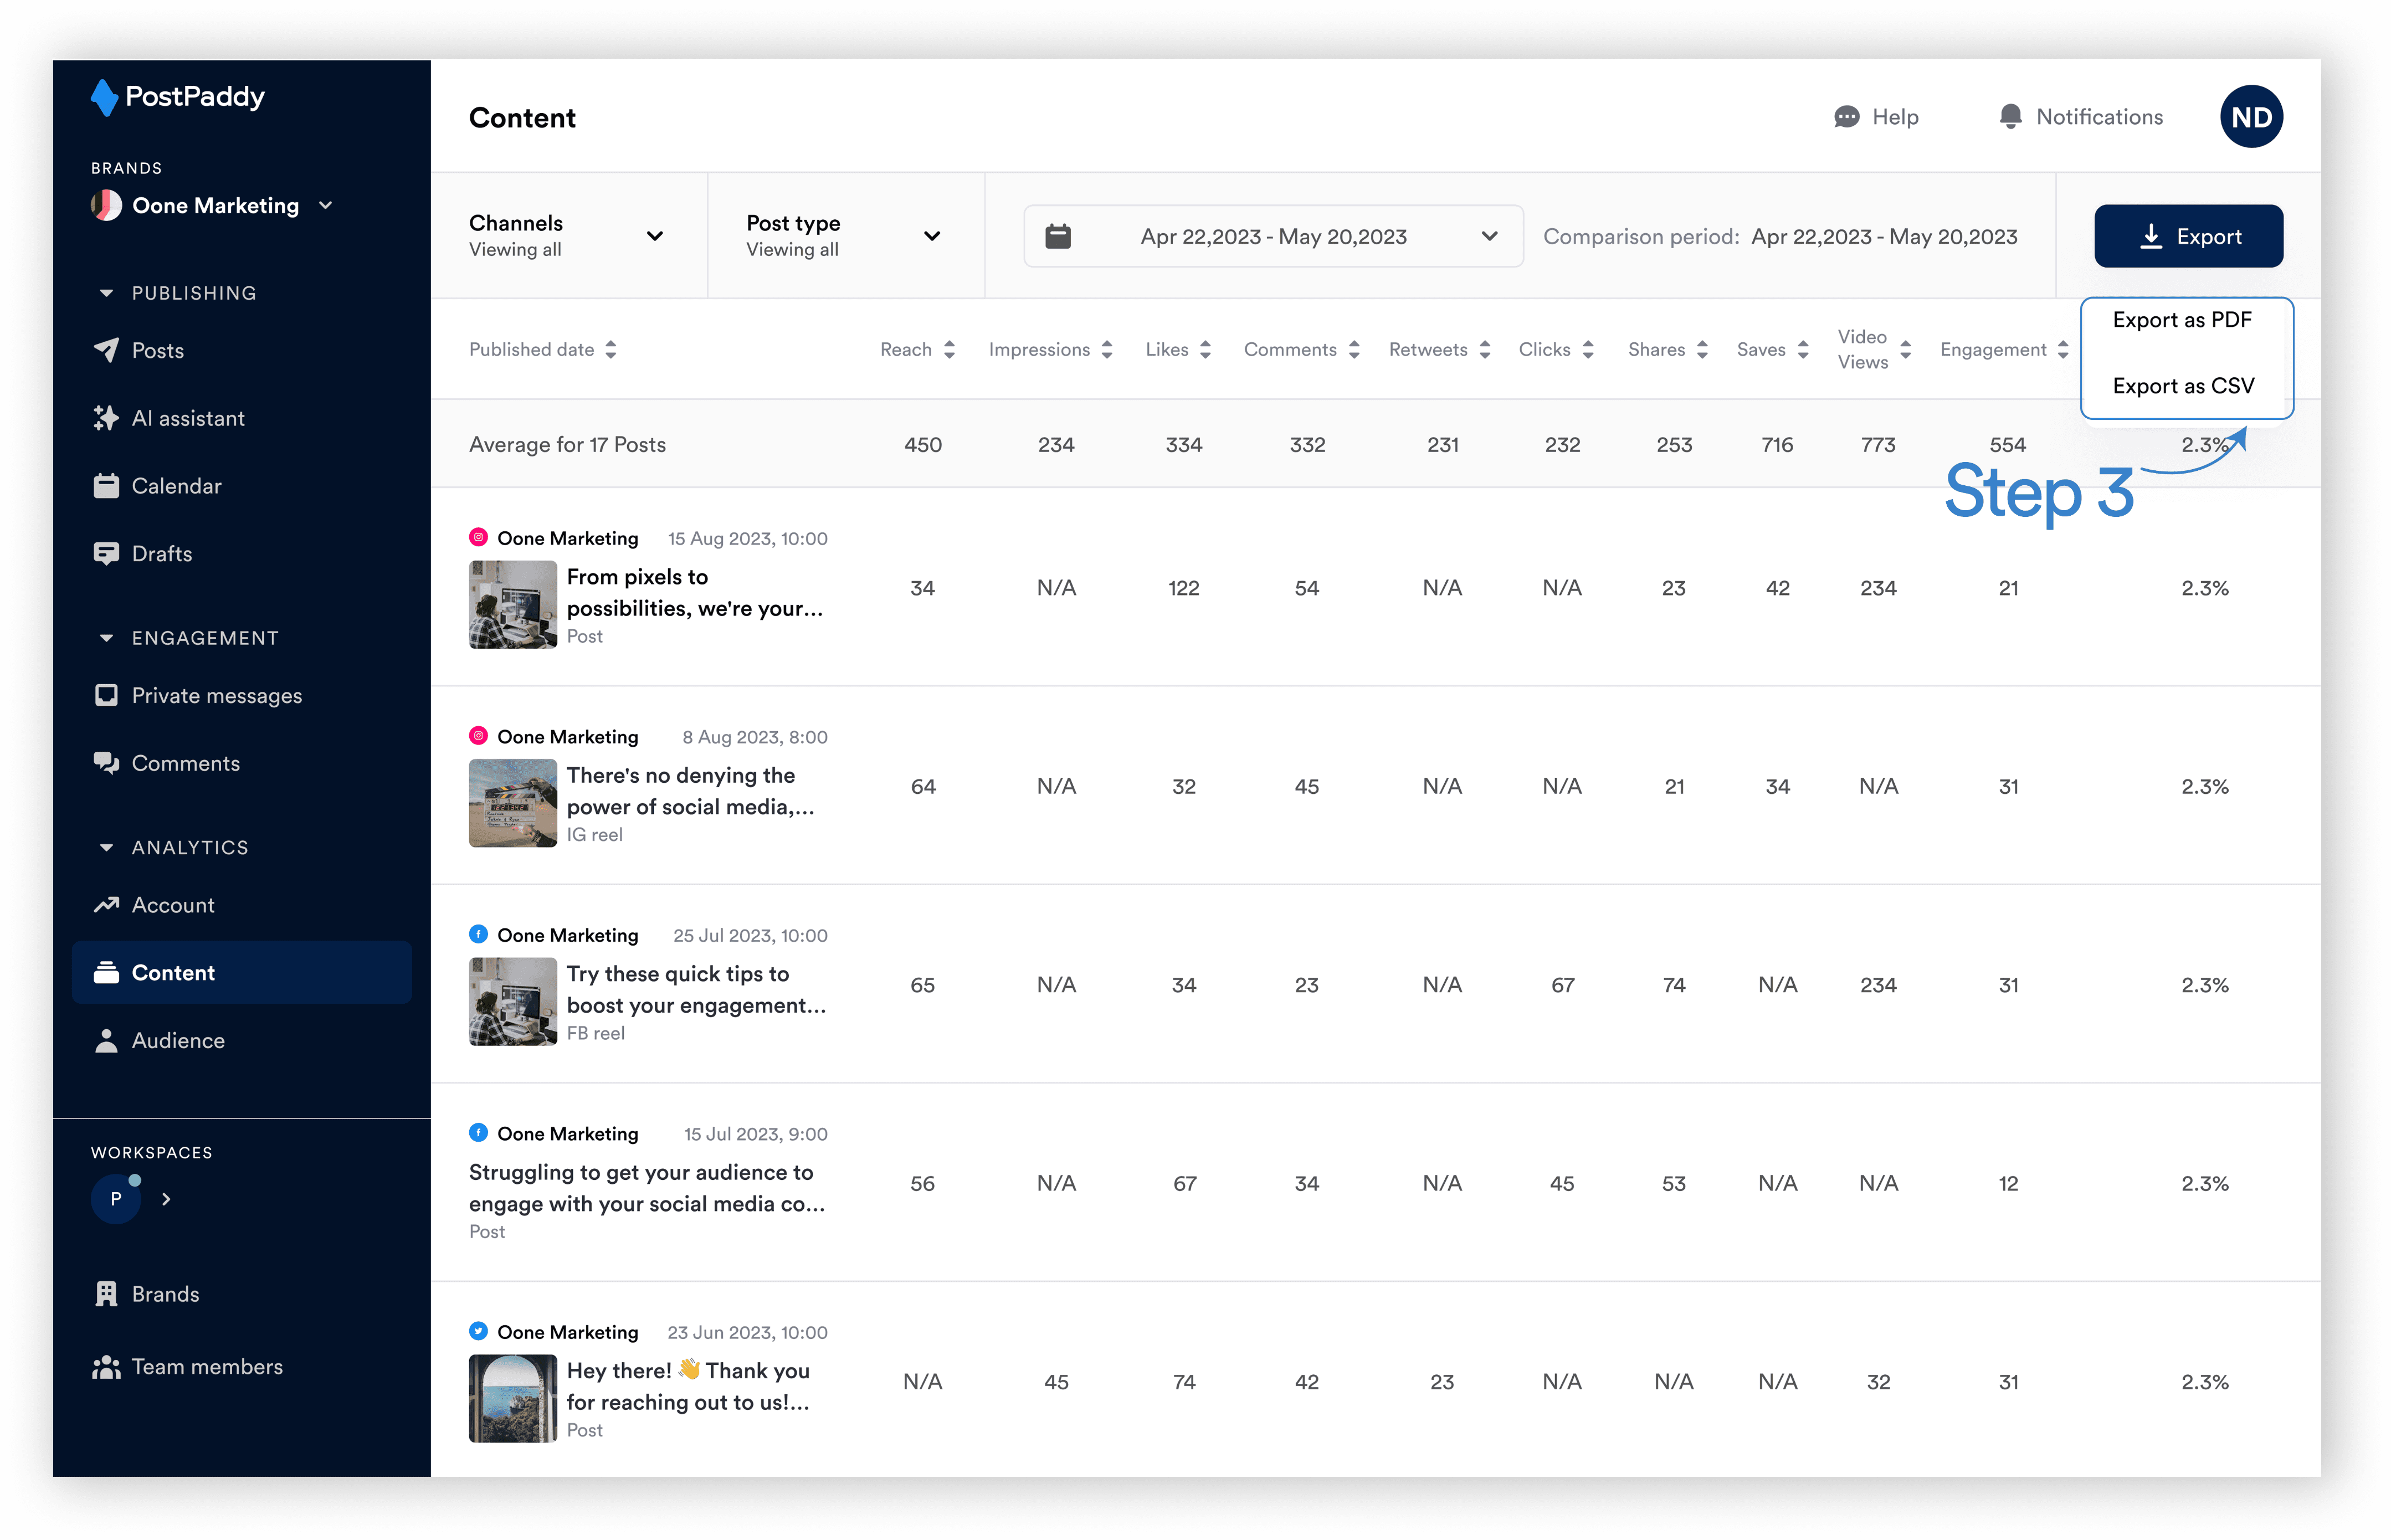
The data should be downloaded on your local device.